Saudi Arabia Specialty Chemicals Market Outlook 2021-2031F
Market Size, Share, Trends, Opportunities, and Competitive Analysis - Segmented by Product Type (Specialty Polymers, Construction and Coatings Chemicals, and Water Treatment, Electronic and Other Chemicals); End-Use Industry (Energy, Construction and Infrastructure, and Manufacturing, Agriculture and Others); Supplier Type (Integrated Producers, and Specialty and Independent Producers); and Region
Saudi Arabia Specialty Chemicals Market to Reach USD 28 Billion by 2031, Growing at an 8% CAGR: How Petrochemical Integration, Vision 2030 and Mega-Projects Are Shifting Output Toward Higher-Value Products
USD 18.2 Billion MARKET SIZE, 2025 | USD 28 Billion MARKET SIZE, 2031F | |
8% CAGR, 2021-2025 | 8% CAGR, 2026E-2031F |
Saudi Arabia Specialty Chemicals Market Overview
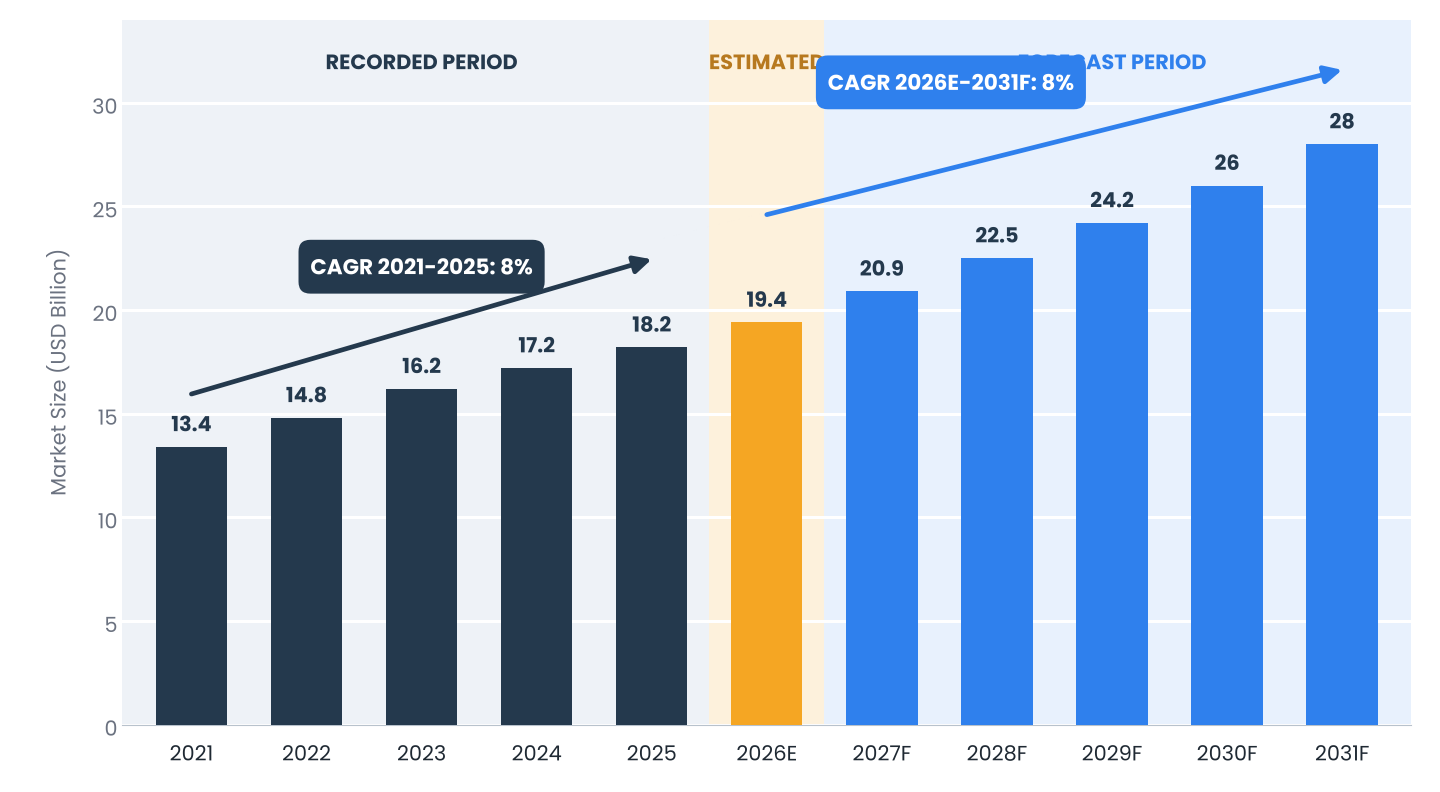
Saudi Arabia is moving from bulk petrochemicals toward higher-value specialty chemicals, supported by integrated feedstock, state ownership and Vision 2030. Neargoal Consulting estimates the Saudi Arabia specialty chemicals market at about USD 18.2 billion in 2025, rising to USD 19.4 billion in 2026E and USD 28 billion by 2031, an 8% CAGR over 2026E-2031F, after an 8% CAGR over 2021-2025. The Kingdom accounts for nearly 12% of global petrochemical production capacity, and its main hubs at Jubail and Yanbu give local specialty producers access to low-cost feedstock.
Key Takeaway Saudi specialty chemicals growth is steady rather than explosive, because the market starts from a large base and depends on moving commodity output up the value chain. Producers that pair integrated feedstock with technical service and local customer proximity will win share. |
Table 1: Saudi Arabia Specialty Chemicals Market: Key Insights
Metric | Finding |
Market Definition | Value of Specialty Chemicals Produced and Sold in Saudi Arabia, Including Polymers, Additives, Coatings, Water Treatment and Electronic Chemicals (USD Billion) |
Base Year / Estimated Year | 2025 / 2026E |
Forecast Period | 2027F-2031F |
Market Size, 2025 | USD 18.2 Billion |
Market Size, 2026E | USD 19.4 Billion |
Market Size, 2031F | USD 28 Billion |
Recorded CAGR, 2021-2025 | 8% |
Forecast CAGR, 2026E-2031F | 8% |
Share of Global Petrochemical Capacity | Nearly 12% |
Main Production Hubs | Jubail and Yanbu |
Crude-to-Chemicals Complex, Aramco and SABIC | About USD 20 Billion, 400,000 Barrels per Day |
Renewable Energy Target | 58.7 GW by 2030 |
Leading Product Type | Specialty Polymers |
Largest End-Use Industry | Energy |
Key Constraints | Skilled Workforce, Energy Demand and Feedstock Shift |
Source: Neargoal Consulting Analysis | |
Market Outlook
Our study estimates the market will grow at an 8% forecast CAGR (2026E-2031F) from USD 19.4 billion in 2026E, after an 8% CAGR over 2021-2025. The base case assumes steady demand from construction, energy and manufacturing, with specialty polymers retaining the largest share and water treatment and electronic chemicals growing faster from smaller bases. A third-party estimate put the 2023 market at USD 16.5 billion, which is consistent with our 2023 figure of USD 16.2 billion.
Figure 1: Saudi Arabia Specialty Chemicals Market Size, 2021-2031F (USD Billion)
Source: Neargoal Consulting Analysis
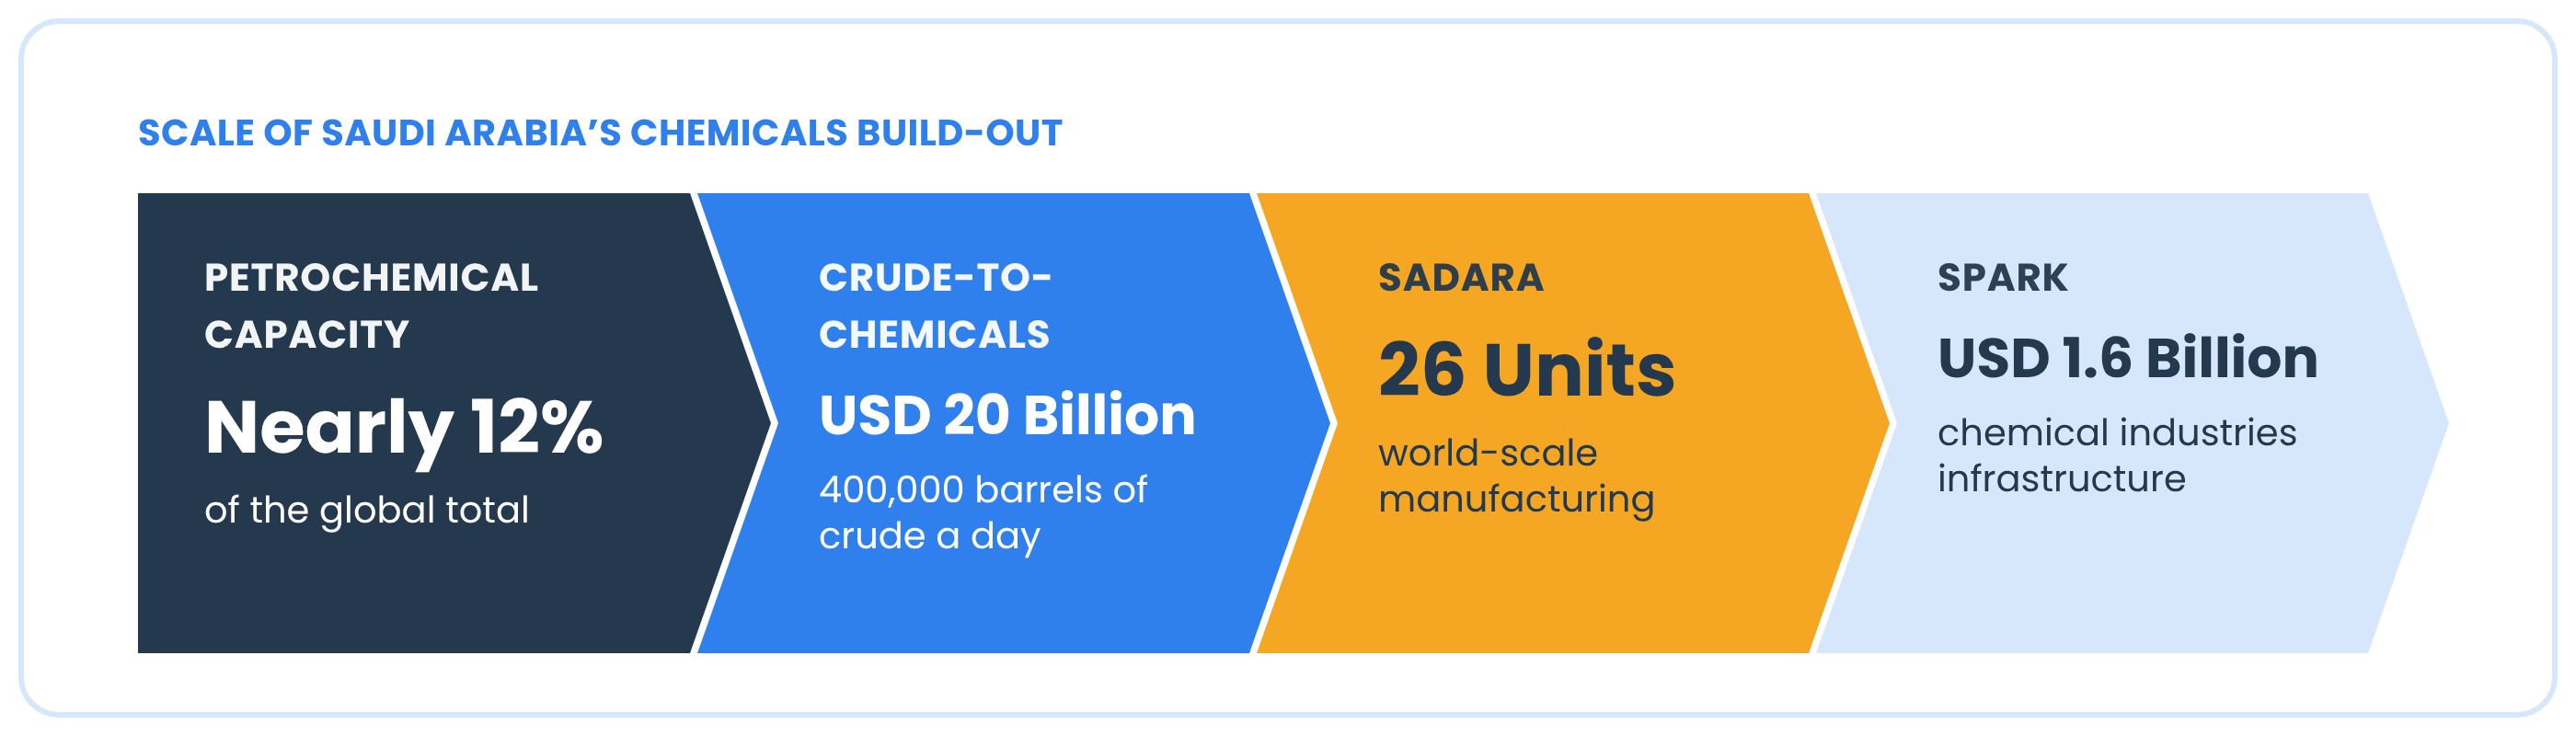
Figure 2: Scale of Saudi Arabia’s Chemicals Build-Out
Source: Neargoal Consulting Analysis
Market Dynamics
Growth Drivers
- Vision 2030 Diversification. The chemicals sector is central to Vision 2030, which aims to reduce dependence on oil exports and raise local value added.
- Integrated Feedstock and Scale. Aramco and SABIC’s crude-to-chemicals complex, valued at about USD 20 billion and designed to convert 400,000 barrels of crude oil a day, and Sadara’s 26 manufacturing units give scale.
- Mega-Projects and Renewables. NEOM, the Red Sea Project and Qiddiya drive demand for construction chemicals and coatings, and a renewable energy target of 58.7 GW by 2030 creates demand for materials.
Restraints
- Skilled Workforce. The sector faces an estimated gap of 5,000-7,000 specialists in 2024.
- Energy and Feedstock Costs. Chemical-sector electricity demand is forecast to exceed 120 TWh by 2025, and feedstock pricing reforms affect margins.
- Competition from Asia. Chinese and Indian producers compete on price in several product types, particularly commodity-grade additives.
Opportunities
- High-Value Specialty Polymers. Moving from commodity polymers to engineered grades raises margin, and SABIC’s certified renewable polymers show a route.
- Water Treatment and Electronic Chemicals. Desalination, industrial water and electronics manufacturing plans create demand for new chemical grades.
- Foreign Partnerships. Tax holidays and 100% foreign ownership in free zones attract partners, and Dow, BASF and Shell have joint ventures with Saudi firms.
- Circular Carbon Economy. Carbon capture, utilization and storage and certified circular products open premium markets.
Policy and Regulatory Landscape
Saudi chemicals policy is set by Vision 2030, the Ministry of Industry and Mineral Resources and Aramco’s downstream strategy. Incentives include tax holidays and 100% foreign ownership in free zones, and special zones such as SPARK, King Salman Energy Park, are being developed with an estimated USD 1.6 billion of infrastructure investment for chemical industries. The Circular Carbon Economy framework emphasizes carbon capture, utilization and storage. The full report assesses how localization requirements, feedstock pricing and sustainability rules affect project economics.
Segment Insights
By Product Type, specialty polymers lead on scale and integration with petrochemical output. The full report quantifies every segment; the highlights below cover End-Use Industry and Supplier Type.
By End-Use Industry
Energy is the largest end-use industry, using chemicals for oil and gas production, refining and power. Construction and infrastructure is the fastest-growing group as mega-projects such as NEOM, the Red Sea Project and Qiddiya require coatings, adhesives and concrete admixtures. Manufacturing, agriculture and consumer goods follow. Our analysis expects water treatment and electronics to gain share from smaller bases.
By Supplier Type
- Integrated Producers. SABIC, Sadara and Petro Rabigh convert feedstock into specialty grades with scale advantages.
- Specialty and Independent Producers. Smaller firms focus on formulated products, technical service and local customer proximity.
Geographic Insights
Production sits on the coasts at Jubail and Yanbu, while consumption centers on Riyadh, Jeddah and Dammam.
- Eastern Province. Jubail is the largest integrated production hub, and the SPARK industrial zone is being developed for chemical industries.
- Western Province. Yanbu and Rabigh provide Red Sea port access, and Jeddah is a major consumption center.
- Central Province. Riyadh leads demand from construction, manufacturing and government projects.
Competitive Landscape
Key participants include SABIC, Sipchem, Sadara Chemical Company, Petro Rabigh, Tasnee, Advanced Petrochemical, Saudi Aramco, Zamil Group, Alujain and KEMYA. SABIC reported 2023 revenue of SAR 177.3 billion, and Aramco holds a 70% stake in the company. Competition rests on feedstock cost, integration and technical service, and international partners such as Dow, BASF and Shell have joint ventures with Saudi firms.
SABIC | Sipchem | Sadara Chemical Company | Petro Rabigh |
Tasnee | Advanced Petrochemical | Saudi Aramco | Zamil Group |
Alujain | KEMYA |
Logos are trademarks of their respective owners, shown for identification only; no affiliation or endorsement is implied.
Key Developments, 2023-2026
- 2023. SABIC reports revenue of SAR 177.3 billion, and Saudi Arabia accounts for nearly 12% of global petrochemical production capacity.
- Crude-to-Chemicals. Aramco and SABIC advance a crude-to-chemicals complex valued at about USD 20 billion and designed to convert 400,000 barrels of crude oil a day.
- SPARK. King Salman Energy Park develops an estimated USD 1.6 billion of infrastructure for chemical industries.
- 2030 Targets. The Kingdom targets 58.7 GW of renewable energy by 2030, creating demand for materials and coatings.
What This Means for Decision-Makers
- Producers: Shift product mix toward engineered grades and secure technical service capability.
- Customers: Localize supply agreements to reduce lead times for mega-project needs.
- Investors: Track the pace of projects such as NEOM and SPARK when assessing demand.
- Policymakers: Link incentives to workforce development and value-added output.
About the Report
Table 2: Saudi Arabia Specialty Chemicals Market: Report Coverage
Coverage Area | What the Report Covers |
Market Size and Forecast | Revenue (USD Billion) and Volume Views, 2021-2031F |
Segmentation | Product Type, End-Use Industry and Region |
Geography | Eastern, Western, Central and Other Provinces |
Competition | Producers, Joint Ventures, Distributors and Project Tracking |
Policy and Constraints | Vision 2030, Incentives, Feedstock Pricing and Workforce |
Outlook and Recommendations | White-Space Assessment and Guidance by Stakeholder |
Source: Neargoal Consulting Analysis | |
The research report, Saudi Arabia Specialty Chemicals Market Outlook 2021-2031F - Market Size, Share, Trends, Opportunities, and Competitive Analysis - Segmented by Product Type (Specialty Polymers, Construction and Coatings Chemicals, and Water Treatment, Electronic and Other Chemicals); End-Use Industry (Energy, Construction and Infrastructure, and Manufacturing, Agriculture and Others); Supplier Type (Integrated Producers, and Specialty and Independent Producers); and Region, covers specialty chemicals produced and sold in Saudi Arabia, with a 2025 base year, a 2026E estimate and a 2027F-2031F forecast. It excludes basic petrochemicals, fertilizers in bulk, refined fuels and exports of bulk commodity products. Market estimates and projections are based on Neargoal Consulting’s proprietary research methodology, exhaustive primary and secondary research.
For questions about report coverage, methodology, suitability, etc.
For requirements beyond the published report