
India Specialty Chemicals Market Outlook 2021-2031F
Market Size, Share, Trends, Opportunities, and Competitive Analysis - Segmented by Product Category (Agrochemicals, Performance and Fine Chemicals, and Dyes, Pigments and Others); End Use Industry (Agriculture, Pharmaceuticals, and Electronics, Paints and Others); Sales Channel (Domestic and Export); and Region
India Specialty Chemicals Market to Reach USD 74 Billion by 2031, Growing at a 9% CAGR: How Domestic Demand, China Plus One Sourcing and Tariff Pressure Are Reshaping the Sector

India Specialty Chemicals Market Overview
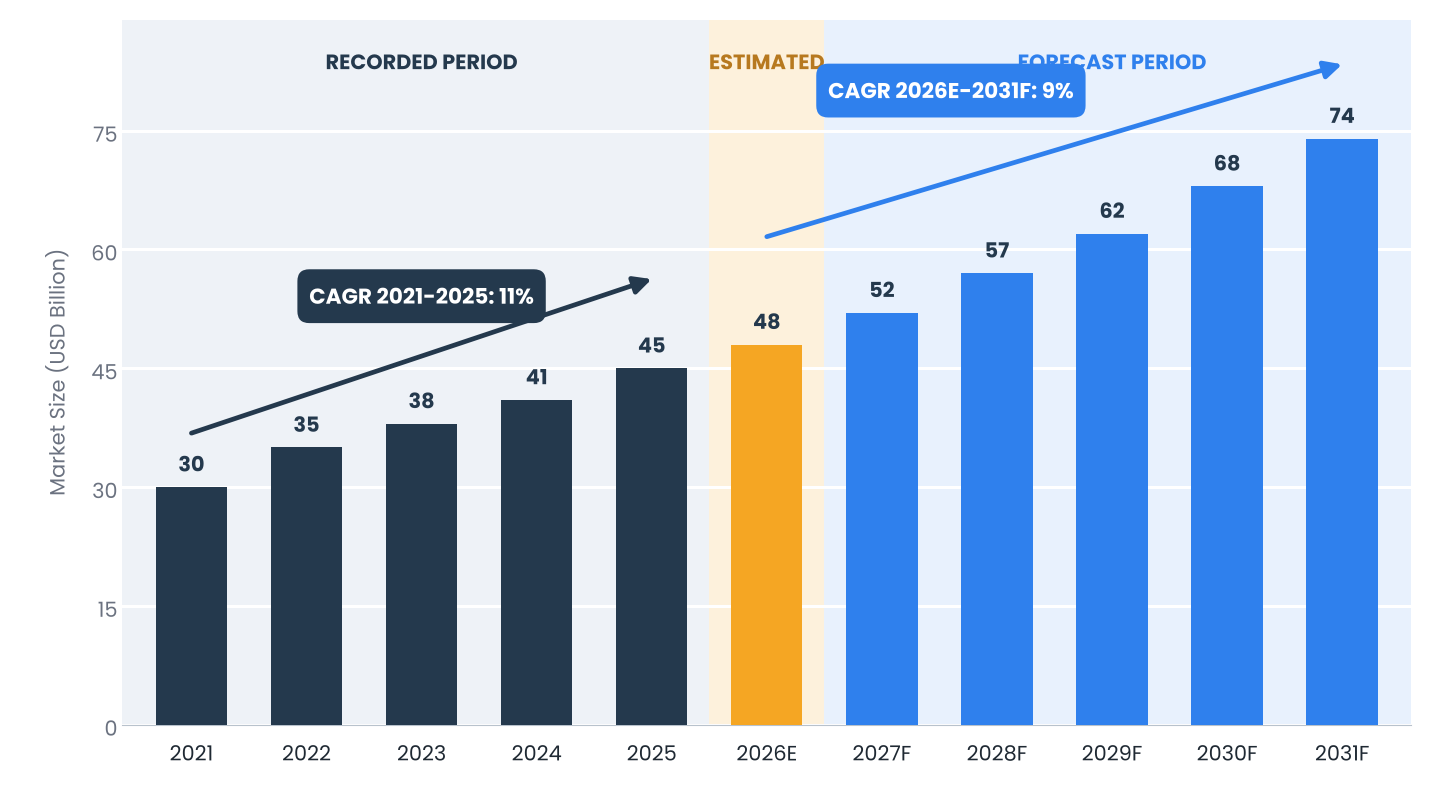
India is one of the larger specialty chemicals producers in Asia, with domestic demand carrying growth. Neargoal Consulting estimates the market at about USD 45 billion in 2025, rising to USD 48 billion in 2026E and USD 74 billion by 2031, a 9% CAGR over 2026E-2031F, after an 11% CAGR over 2021-2025. A rating agency puts sector revenue at about USD 45.9 billion (INR 4 trillion) and expects FY2026 revenue growth of 7-8%, largely volume-driven.
Key Takeaway Volume is growing faster than price. Producers that move toward higher-value, application-specific products and diversify away from commodity-linked pricing will protect margins as domestic demand carries a larger share of growth. |
Table 1: India Specialty Chemicals Market: Key Insights
Metric | Finding |
Market Definition | Value of Specialty Chemicals Sales by Manufacturers Based in India (USD Billion) |
Base Year / Estimated Year | 2025 / 2026E |
Forecast Period | 2027F-2031F |
Market Size, 2025 | USD 45 Billion |
Market Size, 2026E | USD 48 Billion |
Market Size, 2031F | USD 74 Billion |
Recorded CAGR, 2021-2025 | 11% |
Forecast CAGR, 2026E-2031F | 9% |
Sector Revenue, Rating Agency Estimate | About USD 45.9 Billion |
FY2026 Revenue Growth | 7-8%, Volume-Led |
Domestic Share of Revenue | About 63% |
Export Growth, FY2026 | 4-5% |
Leading Product Category | Agrochemicals |
Fastest-Growing Segment | Performance and Fine Chemicals |
Key Constraints | Price Pressure, Tariffs and Imports |
Source: Neargoal Consulting Analysis | |
Market Outlook
Our study estimates the market will grow at a 9% forecast CAGR (2026E-2031F) from USD 48 billion in 2026E, after an 11% CAGR over 2021-2025. The base case assumes volume-led growth with gradual price recovery, domestic demand growing faster than exports, and continued capacity additions in performance and fine chemicals serving pharmaceutical, agricultural and electronics customers.
Figure 1: India Specialty Chemicals Market Size, 2021-2031F (USD Billion)
Source: Neargoal Consulting Analysis
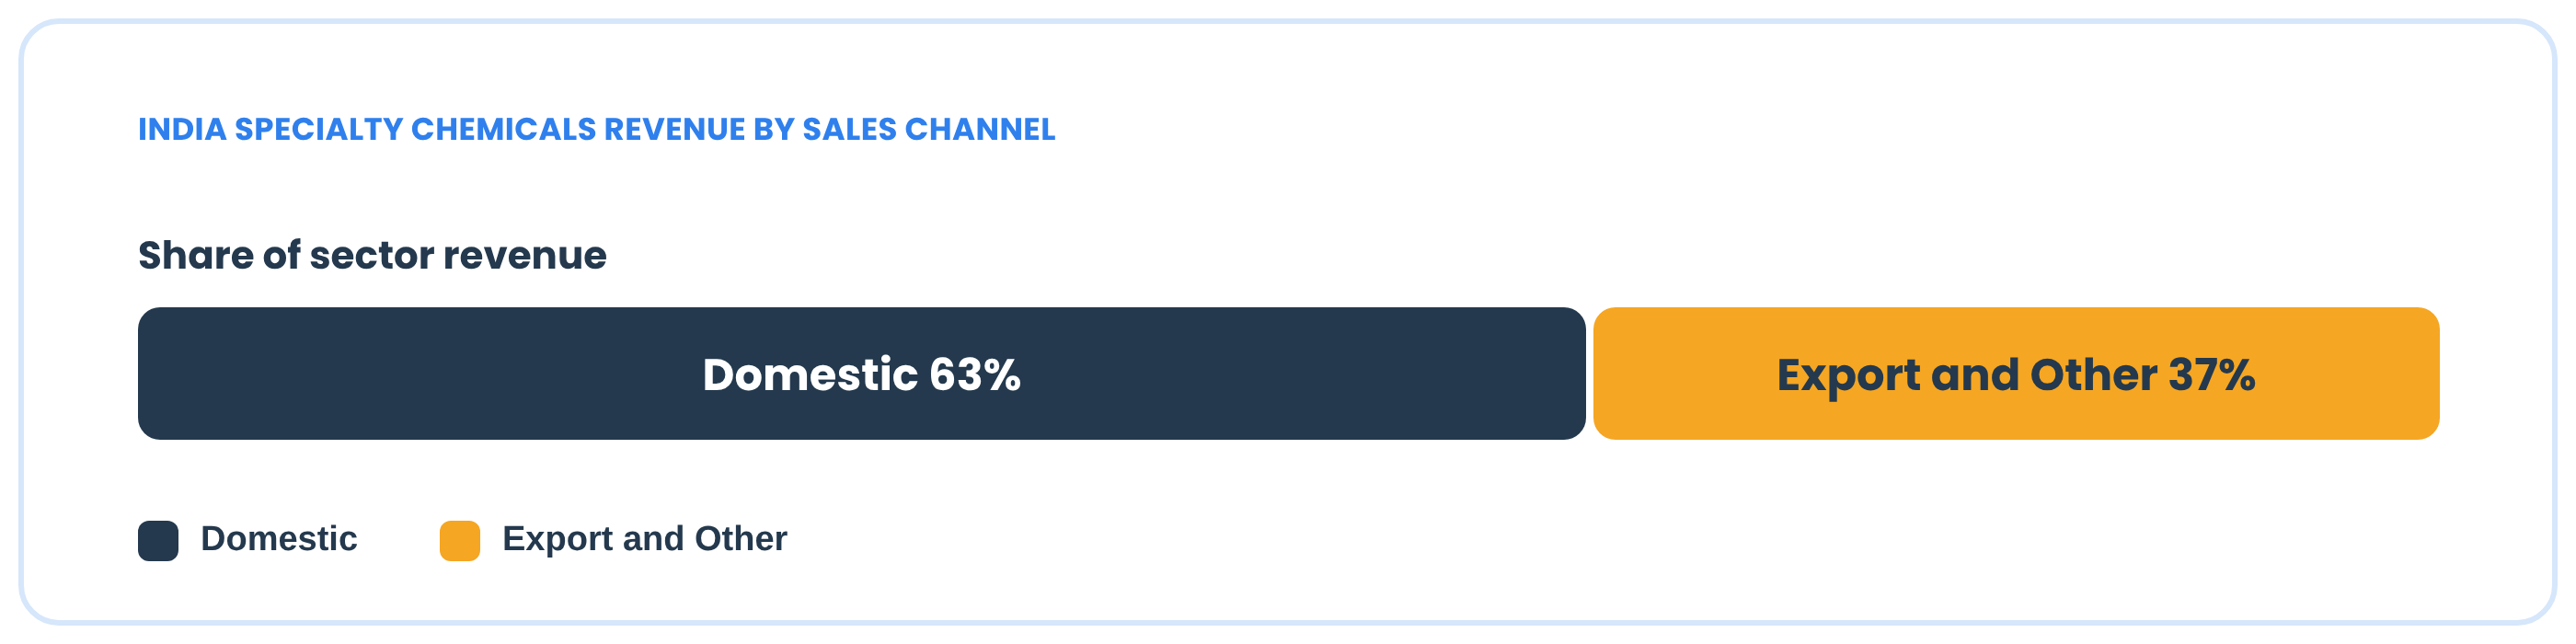
Figure 2: India Specialty Chemicals Revenue by Sales Channel
Source: Neargoal Consulting Analysis
Market Dynamics
Growth Drivers
- Domestic Demand. About 63% of sector revenue comes from domestic sales, which a rating agency expects to grow 8-9% in FY2026.
- China Plus One Sourcing. Global customers are diversifying supply away from a single country, which supports Indian capacity additions and long-term contracts.
- Downstream Growth. Pharmaceuticals, agriculture, paints and electronics are expanding and need application-specific chemistries.
Restraints
- Price Pressure. Growth in FY2026 is expected to be volume-led, with realizations under pressure from imports.
- Export Uncertainty. Export growth is expected at only 4-5%, and tariffs in destination markets can weigh on margins.
- Input Cost and Compliance. Raw material volatility and environmental compliance add cost for smaller producers.
Opportunities
- Fine and Performance Chemicals. Higher-value products for pharmaceutical and electronics customers.
- Contract and Custom Manufacturing. Long-term supply agreements with global customers.
- Backward Integration. Domestic intermediates reduce import dependence.
- Sustainable and Specialty Materials. Water treatment, battery and electronic chemicals.
Policy and Regulatory Landscape
India's chemical sector policy combines production-linked incentives, trade measures and environmental regulation. Anti-dumping and safeguard duties protect domestic producers from imports, and chemical parks and industrial corridors support new capacity. Environmental clearances and effluent standards govern plant approvals and operating costs. The full report assesses how trade measures and environmental rules affect cost, timing and competitiveness.
Segment Insights
The full report quantifies every segment; the highlights below cover Product Category, End Use Industry, and Sales Channel.
By Product Category
Agrochemicals take the largest share of value, while performance and fine chemicals grow fastest.
By End Use Industry
Agriculture is the largest customer group, followed by pharmaceuticals, which pulls through intermediates and fine chemicals. Paints, coatings and electronics add demand for pigments, additives and electronic chemicals. Our analysis expects pharmaceuticals and electronics to grow faster than the sector average.
By Sales Channel
- Domestic. About 63% of sector revenue, expected to grow 8-9% in FY2026.
- Export. The remaining share, expected to grow 4-5% in FY2026.
Geographic Insights
Production concentrates in western and southern India, close to ports and downstream customers.
- Gujarat. The largest chemicals cluster, with ports and chemical parks.
- Maharashtra. Dyes, intermediates and fine chemical production.
- Southern India. Pharmaceutical intermediates and coastal ports.
- Rest of India. Emerging clusters supported by state incentives.
Competitive Landscape
Key participants include Pidilite Industries, SRF, Aarti Industries, Navin Fluorine, Deepak Nitrite, Atul, PI Industries and Vinati Organics. Competition rests on process chemistry, cost position, customer contracts and compliance. Larger producers are integrating backward and moving into higher-value products.
Pidilite Industries | SRF | Aarti Industries | Navin Fluorine |
Deepak Nitrite | Atul | PI Industries | Vinati Organics |
Key Developments, 2025-2026
- March 2025. A rating agency expects FY2026 sector revenue growth of 7-8%, largely volume-driven.
- FY2026. Domestic revenue is expected to grow 8-9% and exports 4-5%.
- FY2026. Profitability pressures are expected to continue but vary across companies.
- 2026. Producers continue capacity additions in fine and performance chemicals.
What This Means for Decision-Makers
- Producers: Shift the mix toward application-specific products with stable contracts.
- Global Customers: Qualify Indian suppliers early for China plus one sourcing.
- Policymakers: Align trade protection with downstream competitiveness.
- Investors: Watch realizations and capacity utilization, not only volumes.
About the Report
Table 2: India Specialty Chemicals Market: Report Coverage
Coverage Area | What the Report Covers |
Market Size and Forecast | Revenue (USD Billion) and Volume Views, 2021-2031F |
Segmentation | Product Category, End Use Industry and Sales Channel |
Geography | Gujarat, Maharashtra, Southern India and Rest of India |
Competition | Producers, Contract Manufacturers and Capacity Tracking |
Policy and Constraints | Trade Measures, Environmental Rules and Price Pressure |
Outlook and Recommendations | Portfolio Guidance by Stakeholder |
Source: Neargoal Consulting Analysis | |
The research report, India Specialty Chemicals Market Outlook 2021-2031F - Market Size, Share, Trends, Opportunities, and Competitive Analysis - Segmented by Product Category (Agrochemicals, Performance and Fine Chemicals, and Dyes, Pigments and Others); End Use Industry (Agriculture, Pharmaceuticals, and Electronics, Paints and Others); Sales Channel (Domestic and Export); and Region, covers sales of specialty chemicals by manufacturers based in India, with a 2025 base year, a 2026E estimate and a 2027F-2031F forecast. It excludes commodity chemicals, petrochemical feedstocks and imported products sold in India. Market estimates and projections are based on Neargoal Consulting’s proprietary research methodology, exhaustive primary and secondary research.
For questions about report coverage, methodology, suitability, etc.
For requirements beyond the published report