
US EV Charging Infrastructure Market Outlook 2021-2031F
Market Size, Share, Trends, Opportunities, and Competitive Analysis - Segmented by Charger Type (DC Fast Charging, Level 2 Public, and Workplace and Residential); Power Level (Below 150 kW, 150-249 kW, and 250 kW and Above); Operator Type (Automaker Networks, Independent Networks, and Retail and Fleet Operators); and Region
US EV Charging Infrastructure Market to Reach USD 13.8 Billion by 2031, Growing at a 17% CAGR: How Higher Power, Open Connectors and Retail Hosts Are Reshaping the Network
USD 5.4 Billion MARKET SIZE, 2025 | USD 13.8 Billion MARKET SIZE, 2031F | |
36% CAGR, 2021-2025 | 17% CAGR, 2026E-2031F |
US EV Charging Infrastructure Market Overview
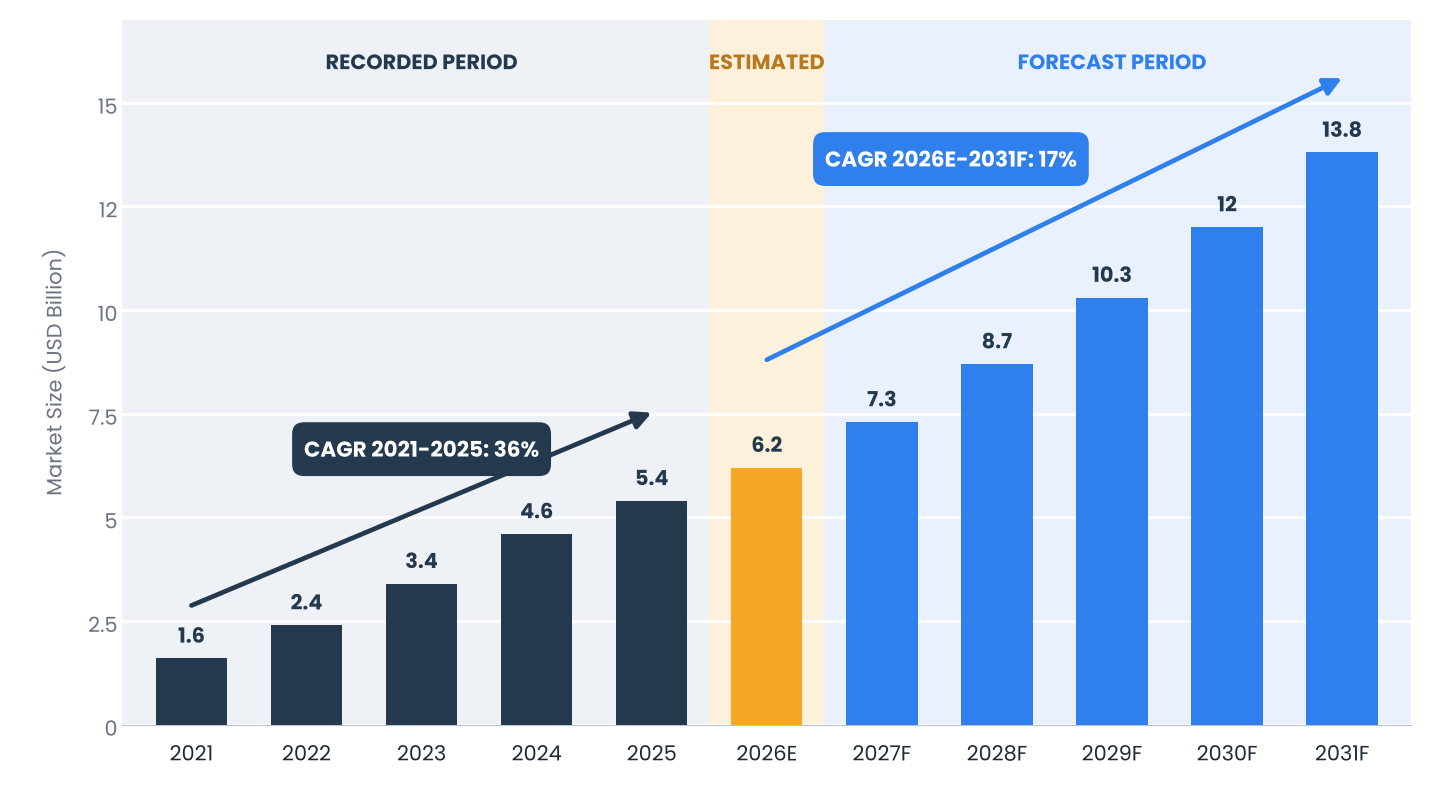
The US fast charging network has passed 80,000 ports and is changing shape as sites get larger and more powerful. Neargoal Consulting estimates charging hardware, installation and network service revenue at about USD 5.4 billion in 2025, rising to USD 6.2 billion in 2026E and USD 13.8 billion by 2031, a 17% CAGR over 2026E-2031F, after a 36% CAGR over 2021-2025. An industry tracker reports that 4,106 ports were added in the third quarter of 2026.
Key Takeaway The market is moving from counting ports to improving each site. Operators that deliver higher power, reliable uptime and open connectors at retail locations will earn higher utilization, while Tesla's share of the network keeps declining. |
US EV Charging Infrastructure Market at a Glance
MARKET DEFINITION Value of Charging Hardware, Installation and Network Service Revenue in the US (USD Billion) | ||
BASE YEAR / ESTIMATED YEAR 2025 / 2026E | FORECAST PERIOD 2027F-2031F | |
MARKET SIZE, 2025 USD 5.4 Billion | MARKET SIZE, 2026E USD 6.2 Billion | |
MARKET SIZE, 2031F USD 13.8 Billion | RECORDED CAGR, 2021-2025 36% | |
FORECAST CAGR, 2026E-2031F 17% | FAST CHARGING PORTS, Q3 2026 More Than 80,000 | |
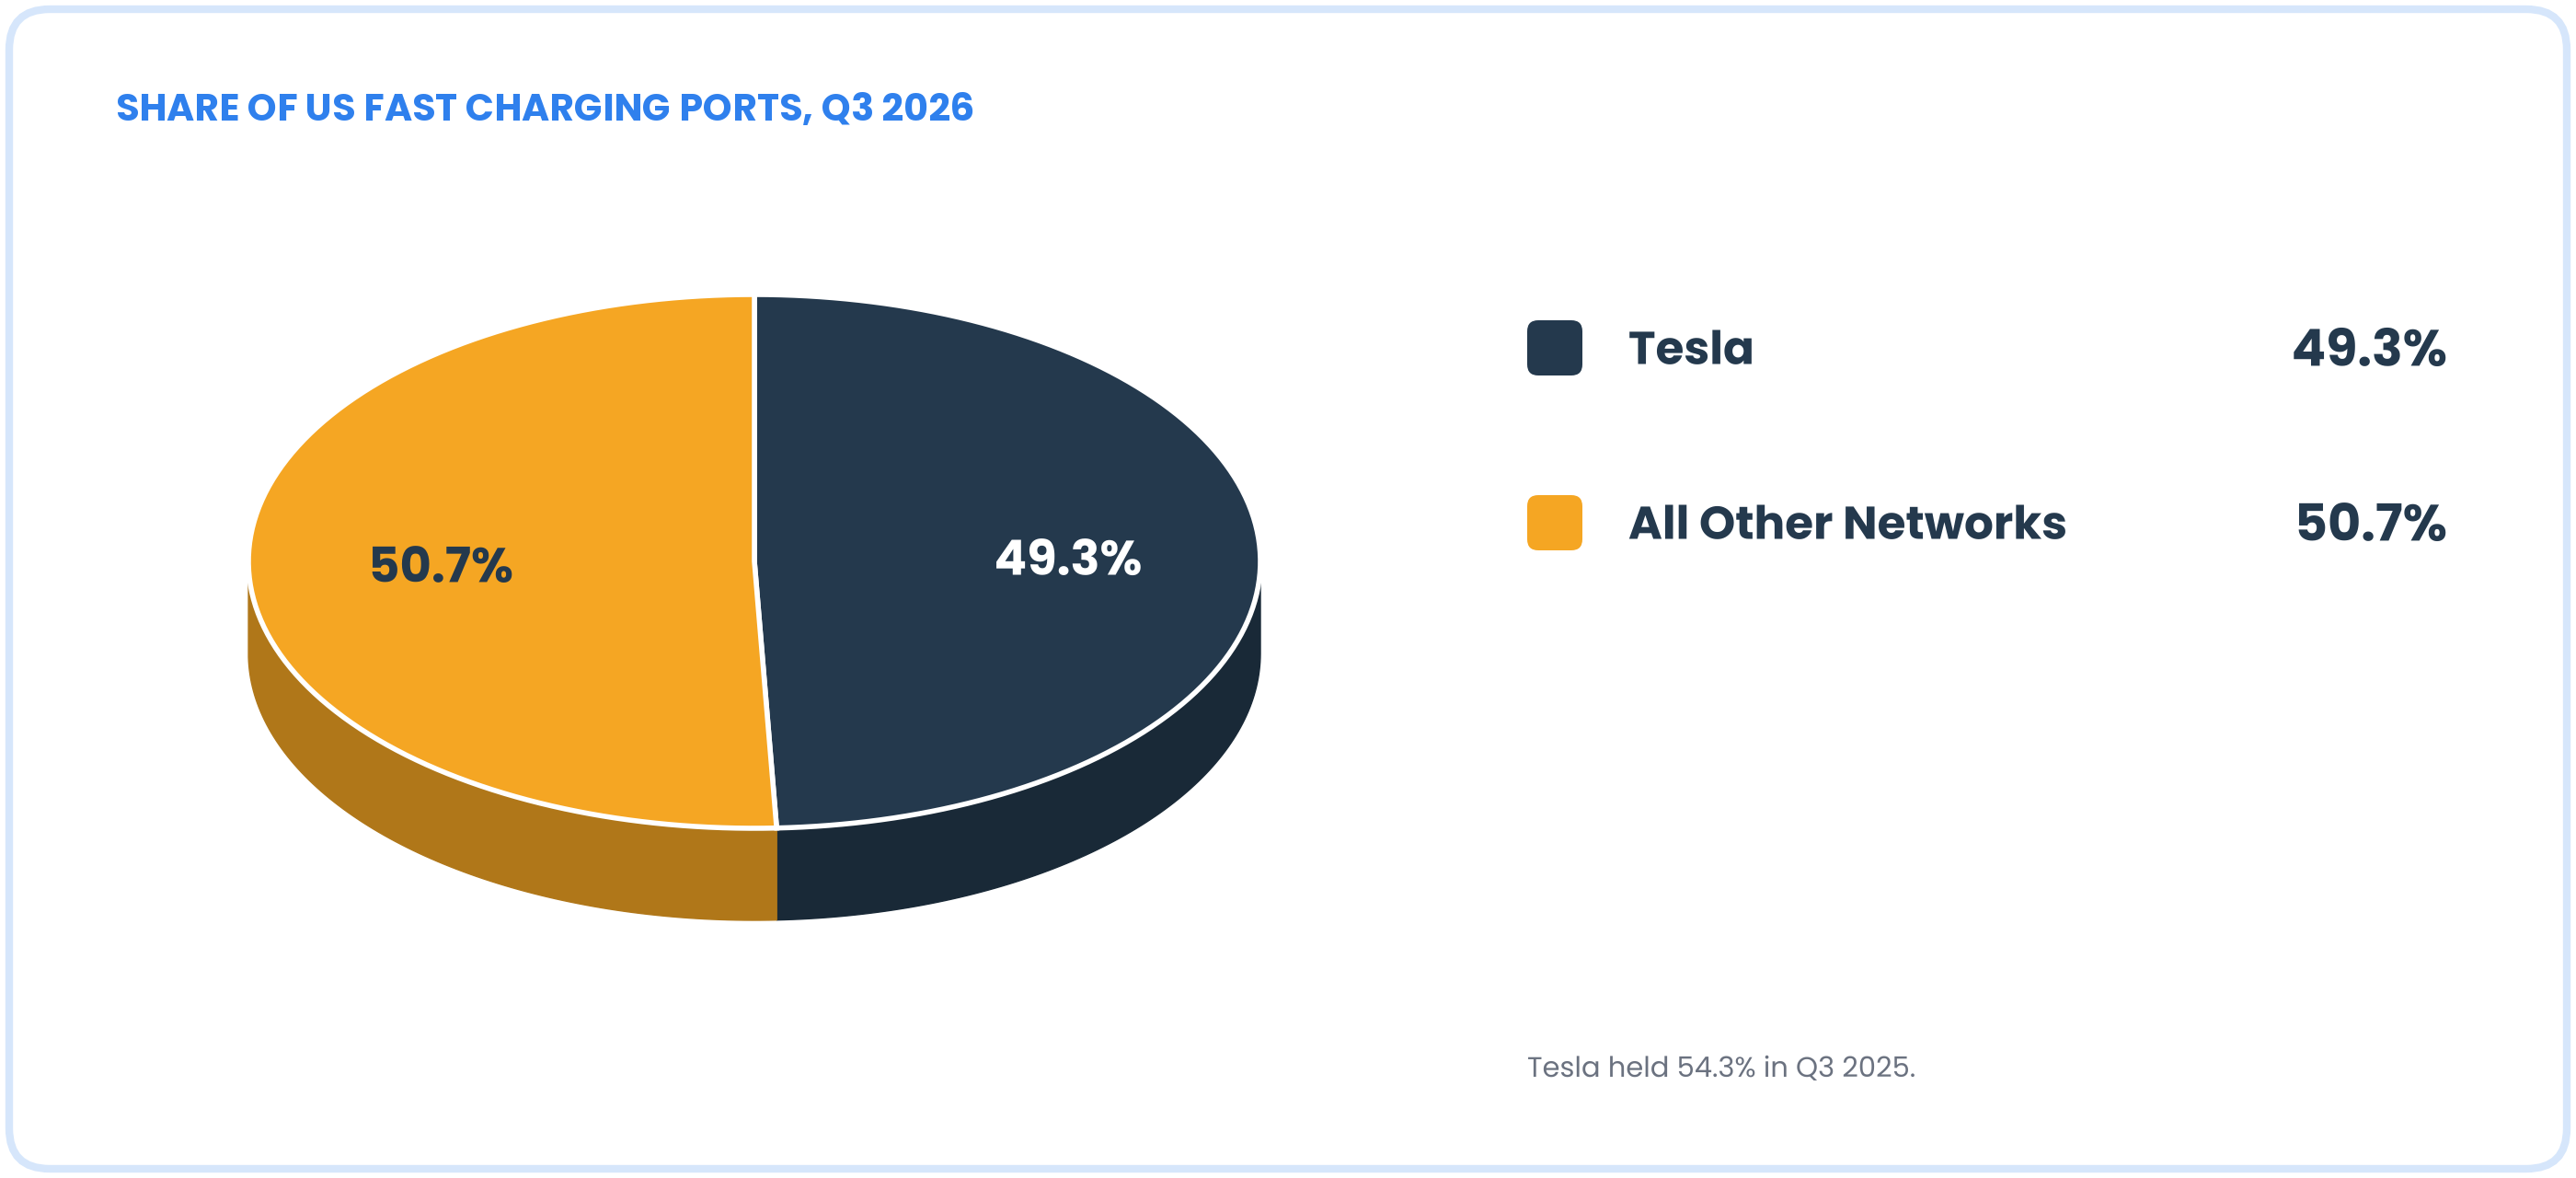
PORTS ADDED IN Q3 2026 4,106 Across 664 Stations | TESLA SHARE OF FAST CHARGING PORTS 49.3%, Down from 54.3% a Year Earlier | |
SHARE OF NEW PORTS AT 250 KW OR HIGHER 73% | LEADING CHARGER TYPE DC Fast Charging | |
FASTEST-GROWING SEGMENT 250 kW and Above | KEY CONSTRAINTS Grid Connection, Utilization and Reliability | |
Source: Neargoal Consulting Analysis | ||
Market Outlook
Our study estimates the market will grow at a 17% forecast CAGR (2026E-2031F) from USD 6.2 billion in 2026E, after a 36% CAGR over 2021-2025. The base case assumes that port additions grow more slowly than spending because sites are getting larger and more powerful, that 250 kW and higher ports become the standard for new sites, and that retail hosts and independent networks take a rising share of additions.
Figure 1: US EV Charging Infrastructure Market Size, 2021-2031F (USD Billion)
Source: Neargoal Consulting Analysis
Market Dynamics
Growth Drivers
- Growth in Electric Vehicle Parc. A larger fleet of electric vehicles raises charging demand, and fast charger utilization averaged 15.9% in the third quarter of 2026.
- Higher Power and Larger Sites. 73% of new ports in the third quarter were rated 250 kW or higher, up from 60% a year earlier.
- Open Connectors and New Entrants. Non-Tesla operators raised the share of new connectors using the North American Charging Standard to 23% from 9%, and new networks such as IONNA and Walmart are adding high-power ports.
Restraints
- Grid Connection and Utility Costs. Interconnection and demand charges set the cost of high-power sites.
- Utilization and Reliability. Average utilization of 15.9% leaves little room for weak operations, and the reliability score was 93.9.
- Policy Uncertainty. Federal funding programs and tax incentives for vehicles and chargers have changed over time, which affects project timing.
Opportunities
- Retail Hosted Charging. Grocery, convenience and big-box sites combine dwell time with customer traffic.
- High-Power Corridor and Urban Hubs. Ports of 400 kW and above serve fast-turnaround demand.
- Fleet and Depot Charging. Commercial fleets need dedicated sites with energy management.
- Software, Payments and Reliability Services. Uptime monitoring and billing tools raise site returns.
Policy and Regulatory Landscape
US charging policy combines federal programs, state rules and utility tariffs. Federal funding for charging corridors has been delivered through state programs, and standards for connectors, reliability and payment shape eligibility. State rules set pricing methods and utility tariffs set demand charges, which determine site economics. The full report assesses how funding, standards and tariffs affect deployment pace and operator returns.
Segment Insights
The full report quantifies every segment; the highlights below cover Charger Type, Power Level, and Operator Type.
By Charger Type
DC fast charging takes the largest share of spending, while Level 2 chargers are the larger installed base.
By Power Level
Ports rated 250 kW and above make up 73% of new installations, up from 60% a year earlier, and Tesla added 303 ports at 500 kW in a single quarter. Lower-power ports remain relevant at destinations with long dwell times. Our analysis expects 250 kW and above to be the standard for new fast charging sites.
By Operator Type
- Automaker Networks. Led by Tesla, whose share of fast charging ports fell from 54.3% to 49.3% in a year.
- Independent Networks. Specialists and joint ventures adding high-power sites.
- Retail and Fleet Operators. Retailers and fleets hosting or operating their own chargers.
Geographic Insights
Deployment is concentrated in urban areas, and growth is spreading beyond the early leaders.
Figure 2: Share of US Fast Charging Ports, Q3 2026
Source: Neargoal Consulting Analysis
- California. The largest market, where deployment slowed in the third quarter of 2026.
- Texas. Rapid deployment that is bringing it close to California.
- Northeast and Mid-Atlantic. Dense corridors and urban hubs.
- Other States. Corridor sites and growing retail partnerships.
Competitive Landscape
Key participants include Tesla, IONNA, Electrify America, EVgo, ChargePoint, Walmart, Circle K and ABB E-mobility. Competition rests on site quality, power levels, reliability and pricing. IONNA and Walmart each added more ports of 400 kW and above than Tesla in the third quarter of 2026, with 378 and 344 ports respectively.
Tesla | IONNA | Electrify America | EVgo |
ChargePoint | Walmart | Circle K | ABB E-mobility |
Key Developments, 2026
- Third Quarter 2026. The US adds 664 fast charging stations and 4,106 ports, passing 80,000 fast charging ports.
- Third Quarter 2026. Tesla accounts for 34.4% of new ports added, and its share of all ports falls to 49.3%.
- Third Quarter 2026. 73% of new ports are rated at least 250 kW.
- Third Quarter 2026. Non-Tesla operators raise the share of new connectors using the North American Charging Standard to 23%.
What This Means for Decision-Makers
- Operators: Prioritize uptime and high-power sites over port count.
- Retail Hosts: Treat chargers as a traffic driver and negotiate shared economics.
- Utilities: Design tariffs that support high-power sites without penalizing low utilization.
- Investors: Track utilization and reliability, not only ports installed.
About the Report
Table 1: US EV Charging Infrastructure Market: Report Coverage
Coverage Area | What the Report Covers |
Market Size and Forecast | Revenue (USD Billion) and Port Views, 2021-2031F |
Segmentation | Charger Type, Power Level and Operator Type |
Geography | California, Texas, Northeast and Mid-Atlantic, and Other States |
Competition | Networks, Retail Hosts and Quarterly Deployment Tracking |
Policy and Constraints | Federal Programs, Utility Tariffs and Standards |
Outlook and Recommendations | Site Strategy and Guidance by Stakeholder |
Source: Neargoal Consulting Analysis | |
The research report, US EV Charging Infrastructure Market Outlook 2021-2031F - Market Size, Share, Trends, Opportunities, and Competitive Analysis - Segmented by Charger Type (DC Fast Charging, Level 2 Public, and Workplace and Residential); Power Level (Below 150 kW, 150-249 kW, and 250 kW and Above); Operator Type (Automaker Networks, Independent Networks, and Retail and Fleet Operators); and Region, covers charging hardware, installation and network service revenue for public and commercial electric vehicle charging in the US, with a 2025 base year, a 2026E estimate and a 2027F-2031F forecast. It excludes vehicle sales and residential charging hardware sold with vehicles. Market estimates and projections are based on Neargoal Consulting’s proprietary research methodology, exhaustive primary and secondary research.
For questions about report coverage, methodology, suitability, etc.
For requirements beyond the published report