US Retail Media Networks Market Outlook 2021-2031F
Market Size, Share, Trends, Opportunities, and Competitive Analysis - Segmented by Ad Format (Onsite Sponsored Search and Display, Offsite and Connected TV, and In-Store and Others); Retailer Type (Marketplace and Mass Retail, Grocery and Drug, and Specialty and Others); Advertiser (Consumer Packaged Goods, Consumer Durables and Apparel, and Other Brands); and Region
US Retail Media Networks Market to Reach USD 124 Billion by 2031, Growing at a 12% CAGR: How Commerce Media, Measurement Standards and Offsite Reach Are Reshaping Brand Budgets

US Retail Media Networks Market Overview
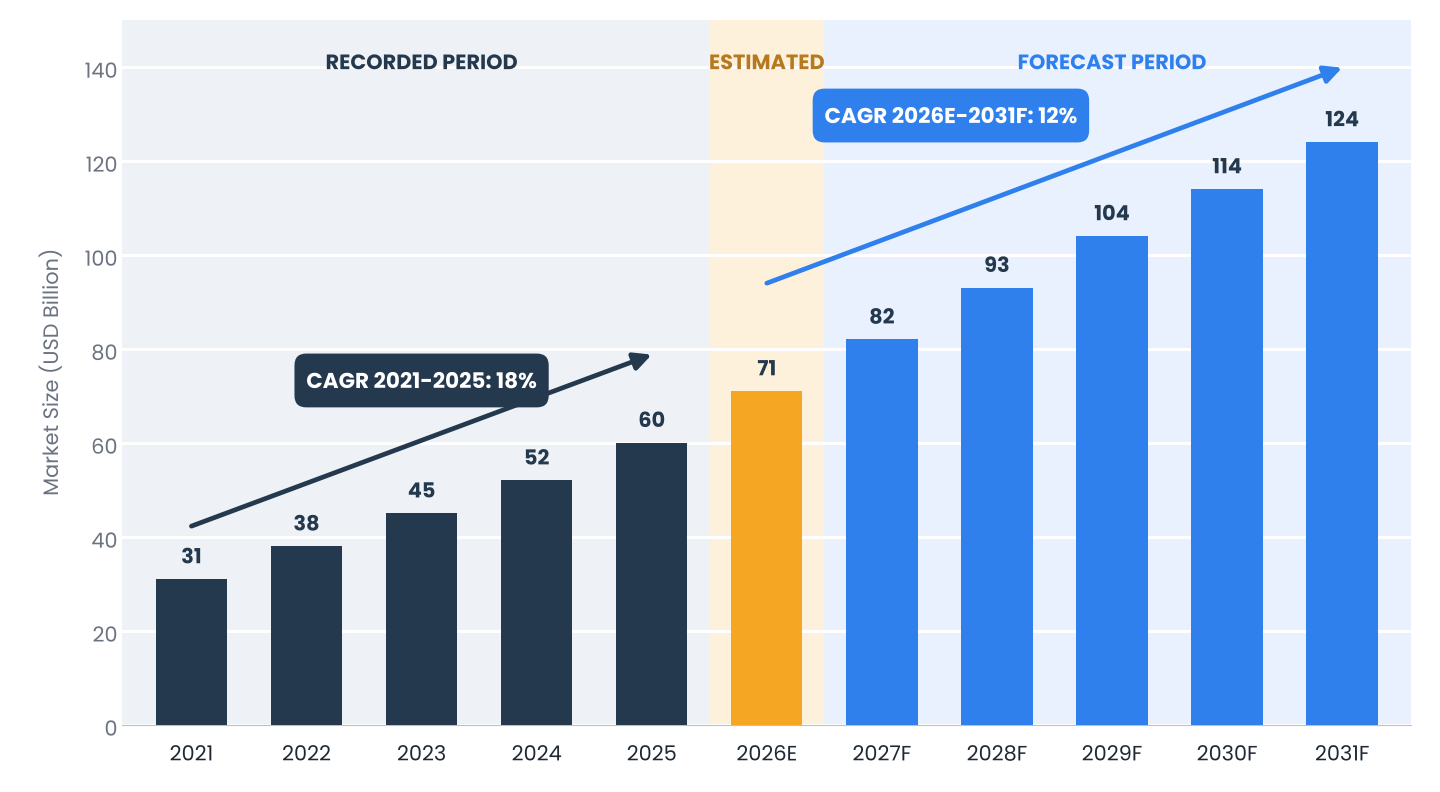
Retail media has become one of the largest advertising channels in the US. Neargoal Consulting estimates network revenue at about USD 60 billion in 2025, rising to USD 71 billion in 2026E and USD 124 billion by 2031, a 12% CAGR over 2026E-2031F, after an 18% CAGR over 2021-2025. A third-party estimate puts 2026 spend at USD 71.09 billion, up about 18%, with about USD 10.5 billion of new spend.
Key Takeaway Growth is concentrating in two networks, while advertisers still question the metrics. Retailers that offer independently verified measurement, offsite reach and standard buying will win the share of budgets that is being spread across smaller networks. |
Table 1: US Retail Media Networks Market: Key Insights
Metric | Finding |
Market Definition | Value of Advertising Revenue Earned by Retailers Through Retail Media Networks in the US (USD Billion) |
Base Year / Estimated Year | 2025 / 2026E |
Forecast Period | 2027F-2031F |
Market Size, 2025 | USD 60 Billion |
Market Size, 2026E | USD 71 Billion |
Market Size, 2031F | USD 124 Billion |
Recorded CAGR, 2021-2025 | 18% |
Forecast CAGR, 2026E-2031F | 12% |
Third-Party 2026 Estimate | USD 71.09 Billion, Up About 18% |
Third-Party 2025 Estimate | USD 60.32 Billion |
New 2026 Spend | About USD 10.5 Billion |
Amazon and Walmart Share of New Spend | About 89% |
Leading Ad Format | Onsite Sponsored Search |
Fastest-Growing Segment | Offsite and Connected TV |
Key Constraints | Measurement Trust and Network Fragmentation |
Source: Neargoal Consulting Analysis | |
Market Outlook
Our study estimates the market will grow at a 12% forecast CAGR (2026E-2031F) from USD 71 billion in 2026E, after an 18% CAGR over 2021-2025. The base case assumes growth moderates as the largest networks mature, while offsite, connected TV and in-store formats take a rising share of new budgets and mid-sized retailers add networks to monetize first-party shopper data.
Figure 1: US Retail Media Networks Market Size, 2021-2031F (USD Billion)
Source: Neargoal Consulting Analysis
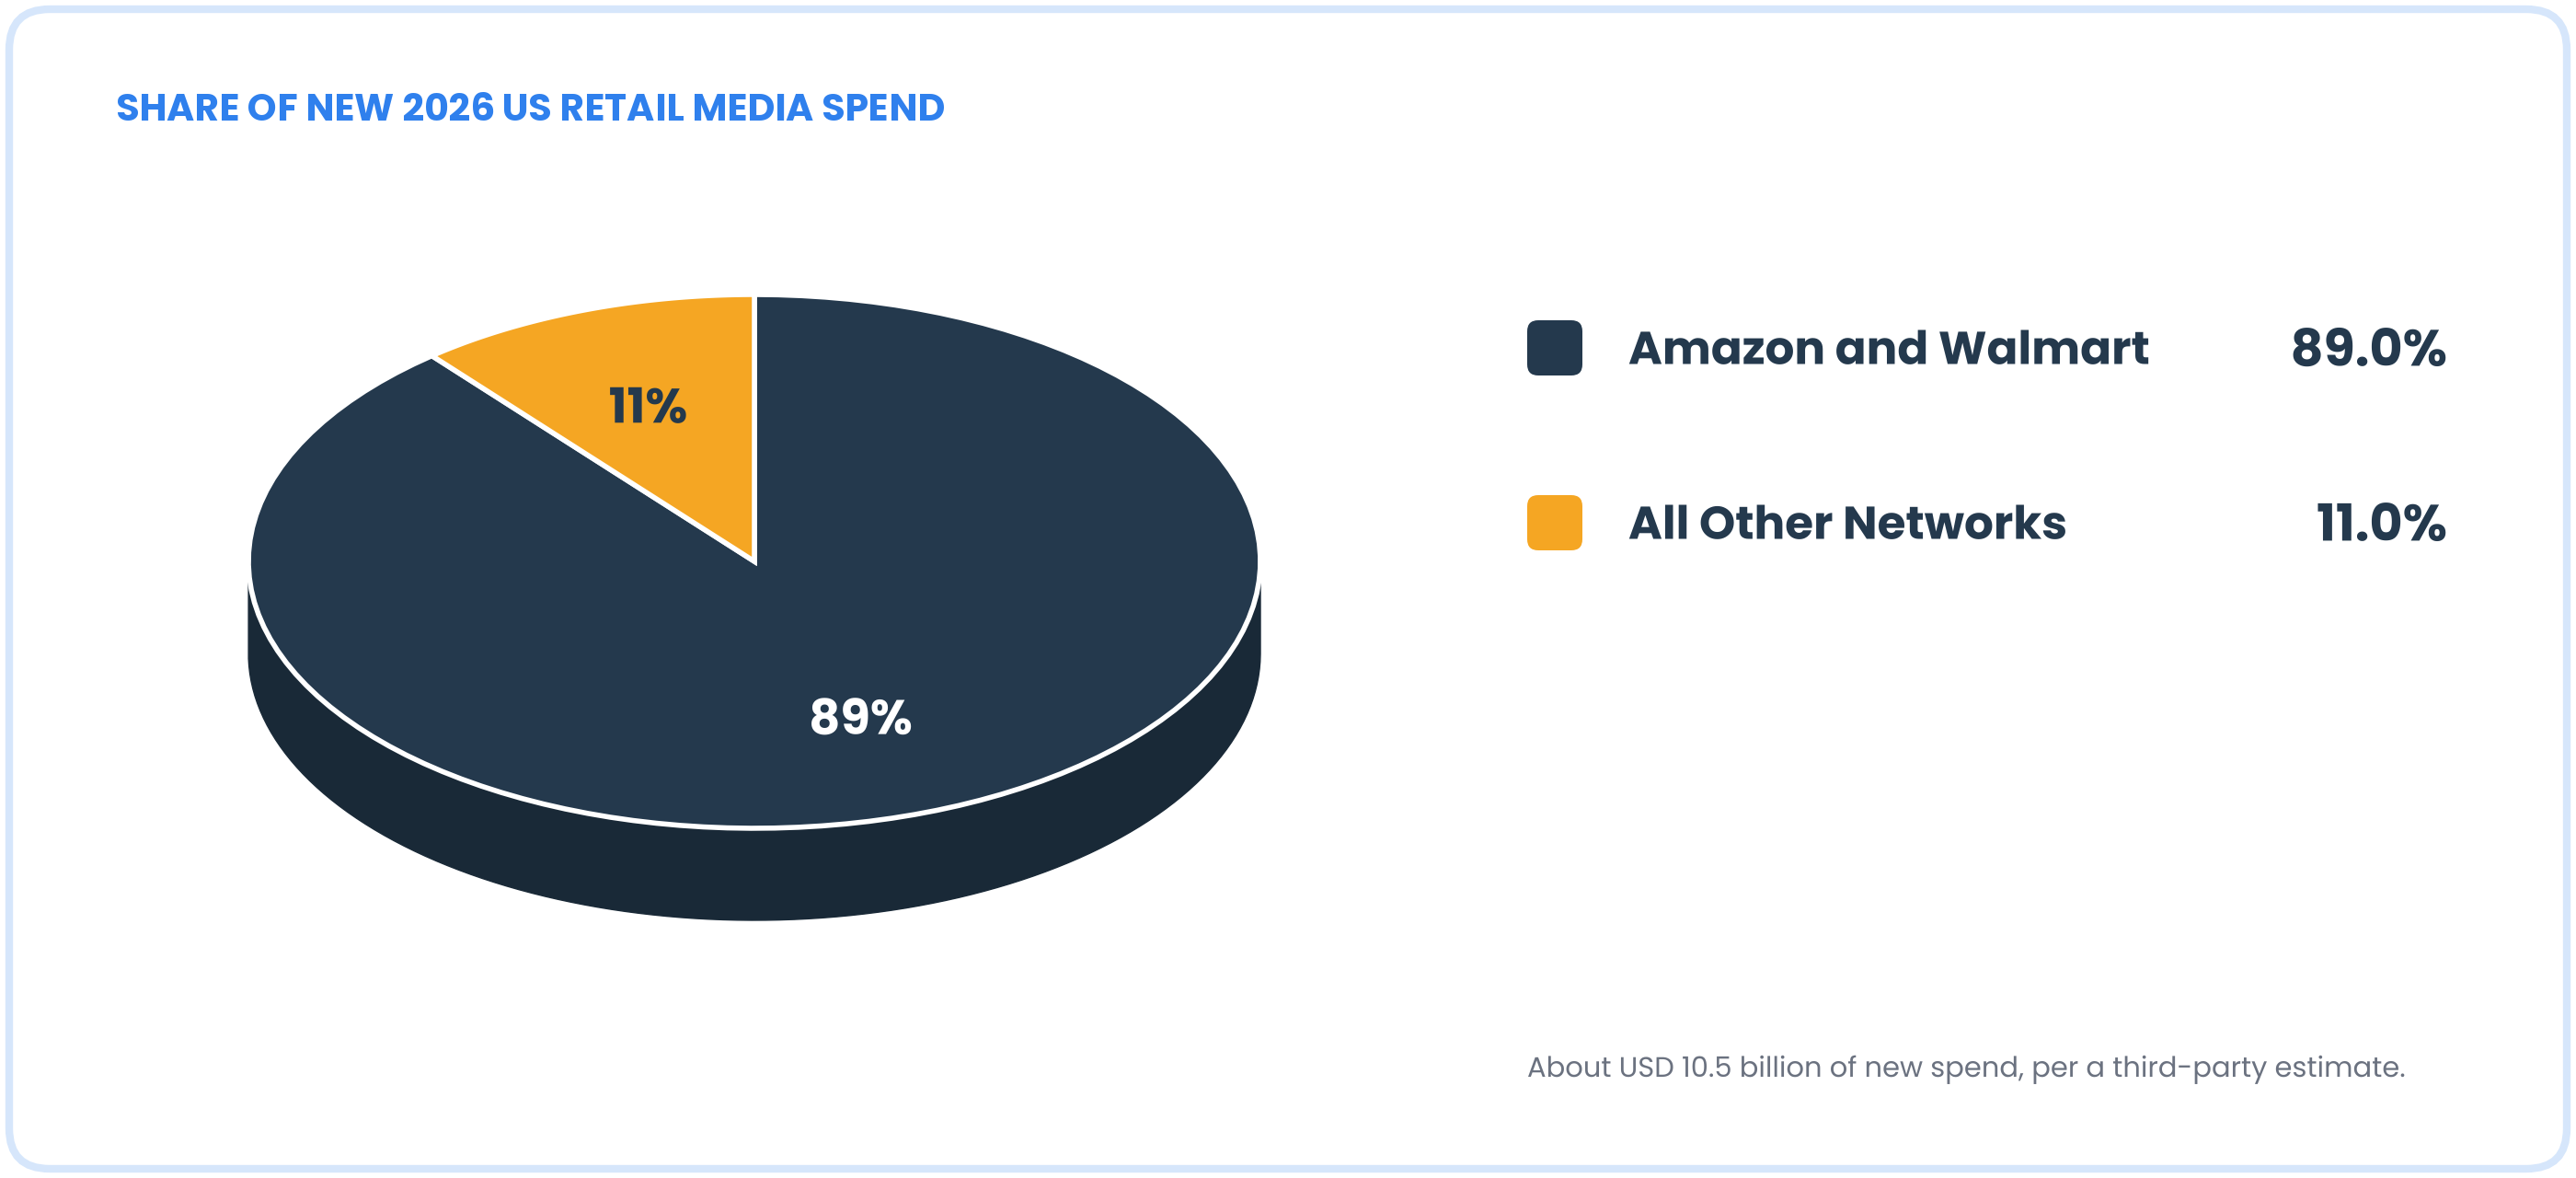
Figure 2: Share of New 2026 US Retail Media Spend
Source: Neargoal Consulting Analysis
Market Dynamics
Growth Drivers
- First-Party Data and Closed-Loop Measurement. Retailers link ad exposure to purchases in their own stores and sites, which supports return-on-ad-spend claims that other channels cannot match.
- Shift of Budgets From Other Channels. A third-party estimate shows about USD 10.5 billion of new spend in 2026, and Amazon and Walmart are projected to take about 89% of it.
- Expansion Beyond the Retailer Site. Offsite, connected TV and in-store screens extend reach beyond sponsored search on the retailer site.
Restraints
- Measurement Trust. Only about 15% of marketers say they measure retail media effectively, and 94% do not fully trust the metrics retailers report.
- Network Fragmentation. Brands manage many separate platforms, buying tools and reporting formats.
- Concentration and Privacy Rules. Two networks capture most new dollars, and state privacy laws limit data use.
Opportunities
- Independent Measurement and Clean Rooms. Third-party verification builds buyer trust.
- Offsite and Connected TV Extensions. Retailer audiences can be activated across the open web and streaming.
- Mid-Sized Retailer Networks. Grocery, drug and specialty retailers monetize loyalty data.
- Self-Serve Platforms for Small Brands. Automation lowers entry costs for smaller advertisers.
Policy and Regulatory Landscape
Retail media is governed by general advertising, consumer protection and privacy law rather than by a dedicated regime. State privacy laws control the use of personal data for targeting, and the Federal Trade Commission oversees advertising claims. Industry bodies have issued measurement guidelines to improve comparability across networks. The full report assesses how privacy rules and measurement standards affect buying and pricing.
Segment Insights
The full report quantifies every segment; the highlights below cover Ad Format, Retailer Type, and Advertiser.
By Ad Format
Onsite sponsored search and display take the largest share of revenue.
By Retailer Type
Marketplace and mass retailers hold most revenue because they combine large audiences with high-intent search. Grocery and drug retailers monetize loyalty data and in-store screens, while specialty retailers serve narrower audiences. Our analysis expects grocery and drug networks to add share as measurement improves.
By Advertiser
- Consumer Packaged Goods. The largest advertisers, reallocating trade and shopper marketing budgets.
- Consumer Durables and Apparel. Brands using retailer data for upper-funnel reach.
- Other Brands. Health, beauty, automotive and financial advertisers testing commerce media.
Geographic Insights
Retail media is national, but network strength follows retailer footprint and the density of store and online traffic.
- Northeast. Dense urban markets with strong omnichannel traffic.
- South. The largest store base for mass and grocery retail.
- Midwest. Large grocery and mass-market footprints.
- West. Technology-forward shoppers and early adoption of new formats.
Competitive Landscape
Key participants include Amazon Ads, Walmart Connect, Target Roundel, Kroger Precision Marketing, Instacart, Home Depot Media Group, Best Buy Ads and Costco. Competition rests on audience size, data quality, measurement and ease of buying. A few networks capture most new spend, while independent platforms connect smaller networks into standard buying.
Amazon Ads | Walmart Connect | Target Roundel | Kroger Precision Marketing |
Instacart | Home Depot | Best Buy | Costco |
Key Developments, 2025-2026
- Third Quarter 2025. Walmart Connect reports 33% growth in US advertising revenue.
- 2026. A third-party estimate puts US retail media spend at USD 71.09 billion, up about 18%.
- 2026. An industry survey finds that only about 15% of marketers believe they measure retail media effectively.
- 2026. Walmart reports that 81% of its shoppers are open to using its shopping assistant for product research.
What This Means for Decision-Makers
- Retailers: Invest in verified measurement and offsite reach to defend share.
- Brands: Standardize reporting across networks before adding new ones.
- Agencies and Platforms: Build cross-network buying and independent verification.
- Investors: Track share of new spend and measurement standards.
About the Report
Table 2: US Retail Media Networks Market: Report Coverage
Coverage Area | What the Report Covers |
Market Size and Forecast | Revenue (USD Billion) and Spend Share Views, 2021-2031F |
Segmentation | Ad Format, Retailer Type and Advertiser |
Geography | Northeast, South, Midwest and West |
Competition | Networks, Platforms and Share-of-Spend Tracking |
Policy and Constraints | Privacy Law, Measurement and Fragmentation |
Outlook and Recommendations | Budget Allocation Guidance by Stakeholder |
Source: Neargoal Consulting Analysis | |
The research report, US Retail Media Networks Market Outlook 2021-2031F - Market Size, Share, Trends, Opportunities, and Competitive Analysis - Segmented by Ad Format (Onsite Sponsored Search and Display, Offsite and Connected TV, and In-Store and Others); Retailer Type (Marketplace and Mass Retail, Grocery and Drug, and Specialty and Others); Advertiser (Consumer Packaged Goods, Consumer Durables and Apparel, and Other Brands); and Region, covers advertising revenue earned by retailers through retail and commerce media networks in the US, with a 2025 base year, a 2026E estimate and a 2027F-2031F forecast. It excludes general search and social advertising and retailer product revenue. Market estimates and projections are based on Neargoal Consulting’s proprietary research methodology, exhaustive primary and secondary research.
For questions about report coverage, methodology, suitability, etc.
For requirements beyond the published report