US Grid-Scale BESS Market Outlook 2021-2031F
Market Size, Share, Trends, Opportunities, and Competitive Analysis - Segmented by Duration (Two-Hour and Shorter, Four-Hour, and Longer-Duration); Application (Standalone, Solar-Plus-Storage, and Other Hybrid); Ownership (Utility-Owned, and Independent Power Producers and Merchant); and Region
US Grid-Scale BESS Market to Reach 100 GWh of Annual Installations by 2031, Growing at a 10% CAGR: How Longer Durations, Data Center Load and Tax Credit Deadlines Are Shaping Deployment

US Grid-Scale BESS Market Overview
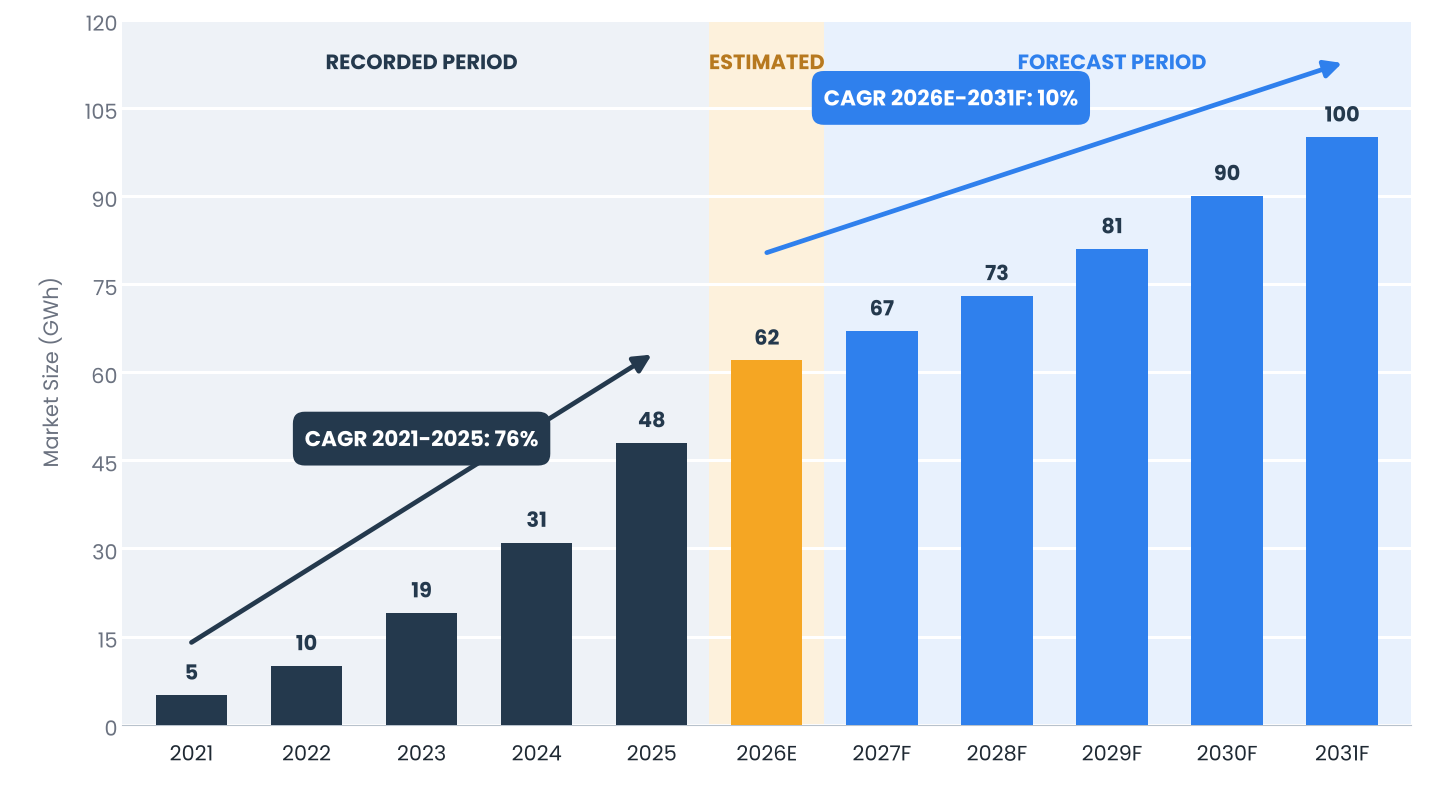
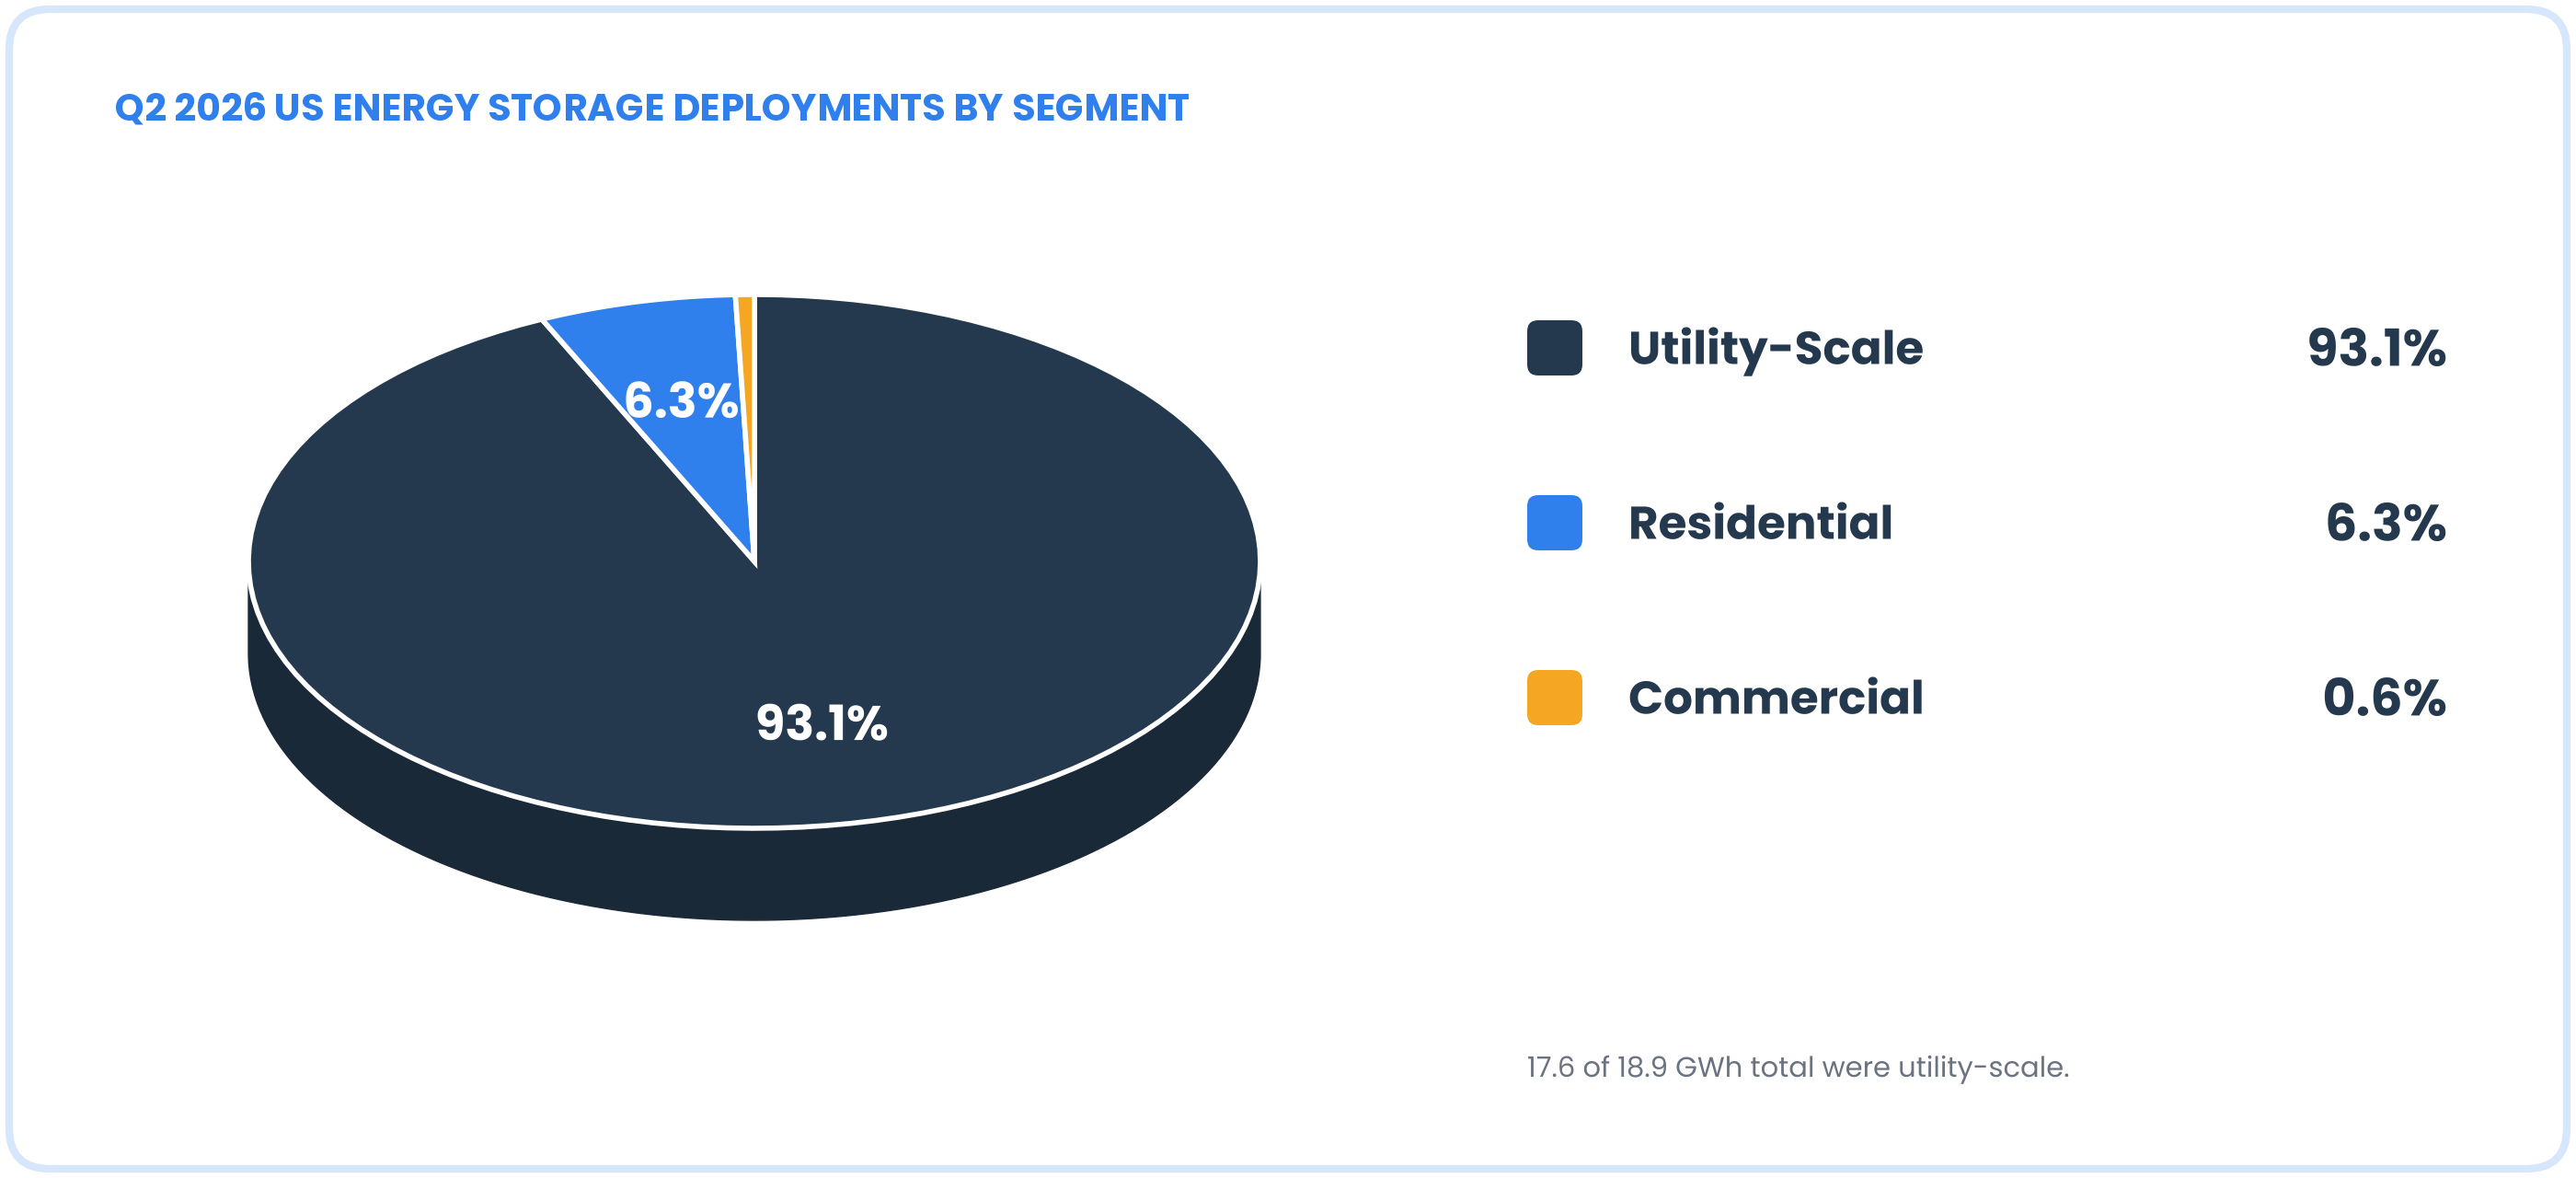
The US is the largest grid-scale battery market in the world outside China, and installations are still setting records. Neargoal Consulting estimates annual utility-scale installations at about 48 GWh in 2025, rising to 62 GWh in 2026E and 100 GWh by 2031, a 10% CAGR over 2026E-2031F, after a 76% CAGR over 2021-2025. Industry trackers recorded 3.3 GW and 8.4 GWh of total installations in the first quarter of 2026 and a record 18.9 GWh in the second quarter, with utility-scale systems at 17.6 GWh.
Key Takeaway Energy capacity is growing faster than power capacity as developers shift to four-hour and longer systems, but deployment is gated by tax credit safe-harbor timing, foreign entity of concern rules and local grid saturation. Developers with compliant supply and grid positions will convert backlog into revenue. |
Table 1: US Grid-Scale BESS Market: Key Insights
Metric | Finding |
Market Definition | Annual Utility-Scale Battery Energy Storage Capacity Installed and Connected to the US Grid (GWh) |
Base Year / Estimated Year | 2025 / 2026E |
Forecast Period | 2027F-2031F |
Market Size, 2025 | 48 GWh |
Market Size, 2026E | 62 GWh |
Market Size, 2031F | 100 GWh |
Recorded CAGR, 2021-2025 | 76% |
Forecast CAGR, 2026E-2031F | 10% |
Q1 2026 Total Installations | 3.3 GW / 8.4 GWh |
Q2 2026 Total Installations | 5.4 GW / 18.9 GWh, a Quarterly Energy Record |
Q2 2026 Utility-Scale Installations | 4.7 GW / 17.6 GWh |
Cumulative Capacity Forecast, 2031 | About 207 GW / 715 GWh |
Leading Application | Standalone and Solar-Plus-Storage |
Fastest-Growing Segment | Four-Hour and Longer Duration |
Key Constraints | Tax Credit Deadlines, FEOC Rules and Grid Saturation |
Source: Neargoal Consulting Analysis | |
Market Outlook
Our study estimates the market will grow at a 10% forecast CAGR (2026E-2031F) from 62 GWh in 2026E, after a 76% CAGR over 2021-2025 from a small base. The base case assumes a mid-2026 slowdown as safe-harbored projects are completed, followed by acceleration from 2028F as data center and electrification load grows. Industry trackers forecast cumulative installed capacity of about 207 GW and 715 GWh by 2031, with utility-scale growth accelerating between 2028 and 2031.
Figure 1: US Grid-Scale BESS Market Size, 2021-2031F (GWh)
Source: Neargoal Consulting Analysis
Figure 2: Share of Q2 2026 US Energy Storage Deployments by Segment
Source: Neargoal Consulting Analysis
Market Dynamics
Growth Drivers
- Load Growth and Data Centers. Expanding electricity demand from data centers and electrification, and replacement of retiring thermal plants, raise the need for firm capacity and peak shifting.
- Longer-Duration Procurement. Utility adequacy requirements and local grid constraints are shifting procurement toward four-hour and longer systems, lifting energy installed per megawatt.
- Tax Credit Safe Harbor. A rush of projects starting construction to secure Investment Tax Credit safe harbor status carried record activity into 2026.
Restraints
- Foreign Entity of Concern Rules. Limited availability of compliant battery systems constrains near-term utility-scale growth.
- Safe-Harbored Backlog and Mid-2026 Slowdown. Industry trackers expect a mid-2026 slowdown that offsets record late-2025 construction starts.
- Grid Saturation. California and Texas are described as approaching local grid saturation in some areas, raising interconnection challenges.
Opportunities
- Longer-Duration Systems. Four-hour and longer systems earn higher capacity value and are the fastest-growing segment.
- Data Center-Linked Storage. Co-located or utility storage supports data center load growth and interconnection timing.
- Domestic Cell Manufacturing. Domestic battery cell capacity is scaling up and helps meet compliance rules.
- Emerging State Markets. Michigan, Georgia, New York and Illinois are emerging markets, and community storage is growing in Illinois, Maryland, Massachusetts and New York.
Policy and Regulatory Landscape
Federal tax policy sets the pace. The Investment Tax Credit supports storage, and a rush to begin construction to secure safe-harbor status drove late-2025 starts. Foreign entity of concern rules limit the supply of compliant systems, and expiry of the Section 25D residential credit drove a late-2025 residential surge. State programs matter too, including California’s Net Billing Tariff and Self-Generation Incentive Program for commercial systems. The full report assesses how tax, trade and interconnection rules affect project economics and timing.
Segment Insights
The full report quantifies every segment; the highlights below cover Duration, Application, and Ownership.
By Duration
Four-hour and longer systems are gaining share as procurement shifts.
By Application
Standalone and solar-plus-storage systems account for most installations. Standalone projects benefit from flexible siting and merchant revenues, while solar-plus-storage uses shared interconnection and tax credits. Other hybrid projects pair storage with wind or gas plants. Our analysis expects standalone systems to take more share as developers seek grid-connected flexibility.
By Ownership
- Utility-Owned. Regulated utilities building storage to meet adequacy and resource plan requirements.
- Independent Power Producers and Merchant. Developers selling capacity and energy under long-duration contracts or in organized markets.
Geographic Insights
California and Texas hold the largest installed bases, and other states are emerging.
- California. The largest state market, with utility-scale systems approaching local grid saturation in places and incentives supporting commercial storage.
- Texas. A large merchant market with rapid additions, also approaching local grid saturation in some areas.
- Arizona, Nevada and Southwest. Solar-plus-storage clusters supported by utility procurement.
- Emerging States. Michigan, Georgia, New York and Illinois are emerging markets.
Competitive Landscape
Key participants include Tesla, Fluence, NextEra Energy Resources, LS Power, Vistra, AES, Wärtsilä and Sungrow. Competition is shifting from equipment supply to compliant supply chains, grid positions and long-duration contracts. Developers that safe-harbored projects in late 2025 hold a near-term advantage as foreign entity of concern rules limit compliant supply.
Tesla | Fluence | NextEra Energy Resources | LS Power |
Vistra | AES | Wärtsilä | Sungrow |
Key Developments, 2025-2026
- Late 2025. Developers rush to begin construction to secure Investment Tax Credit safe-harbor status, and the Section 25D residential credit expires.
- First Quarter 2026. Total installations reach 3.3 GW and 8.4 GWh, with utility-scale at 2.3 GW and 6.8 GWh.
- June 2026. Industry trackers release a forecast of cumulative capacity of about 207 GW and 715 GWh by 2031.
- Second Quarter 2026. Quarterly deployments reach a record 18.9 GWh, with utility-scale at 4.7 GW and 17.6 GWh.
What This Means for Decision-Makers
- Developers: Secure compliant supply and grid positions and prioritize four-hour systems.
- Utilities: Align procurement with adequacy needs and local grid constraints.
- Investors: Underwrite on safe-harbor status, supply compliance and contract length.
- Suppliers: Prepare compliant, domestic or allied supply chains.
About the Report
Table 2: US Grid-Scale BESS Market: Report Coverage
Coverage Area | What the Report Covers |
Market Size and Forecast | Installed Energy (GWh) and Investment (USD) Views, 2021-2031F |
Segmentation | Duration, Application, Ownership and State |
Geography | California, Texas, Southwest, Emerging States and Other States |
Competition | Developers, Integrators, Utilities and Pipeline Tracking |
Policy and Constraints | Tax Credits, Compliance Rules, Tariffs and Interconnection |
Outlook and Recommendations | White-Space Assessment and Guidance by Stakeholder |
Source: Neargoal Consulting Analysis | |
The research report, US Grid-Scale BESS Market Outlook 2021-2031F - Market Size, Share, Trends, Opportunities, and Competitive Analysis - Segmented by Duration (Two-Hour and Shorter, Four-Hour, and Longer-Duration); Application (Standalone, Solar-Plus-Storage, and Other Hybrid); Ownership (Utility-Owned, and Independent Power Producers and Merchant); and Region, covers utility-scale, grid-connected battery energy storage systems in the US, with a 2025 base year, a 2026E estimate and a 2027F-2031F forecast. It excludes residential and small commercial systems, pumped hydro storage and electric vehicle batteries. Market estimates and projections are based on Neargoal Consulting’s proprietary research methodology, exhaustive primary and secondary research.
For questions about report coverage, methodology, suitability, etc.
For requirements beyond the published report