
UK Offshore Wind Market Outlook 2021-2031F
Market Size, Share, Trends, Opportunities, and Competitive Analysis - Segmented by Component (Turbines, Foundations and Substructures, and Cables, Installation and Services); Foundation Type (Fixed-Bottom and Floating); Project Stage (Operations and Maintenance, Under Construction, and Development and Pre-Construction); and Region
UK Offshore Wind Market to Reach USD 13.2 Billion by 2031, Growing at a 15% CAGR: How Auction Awards, Clean Power 2030 and Grid Reform Are Driving the Build-Out
USD 5.8 Billion MARKET SIZE, 2025 | USD 13.2 Billion MARKET SIZE, 2031F | |
8% CAGR, 2021-2025 | 15% CAGR, 2026E-2031F |
UK Offshore Wind Market Overview
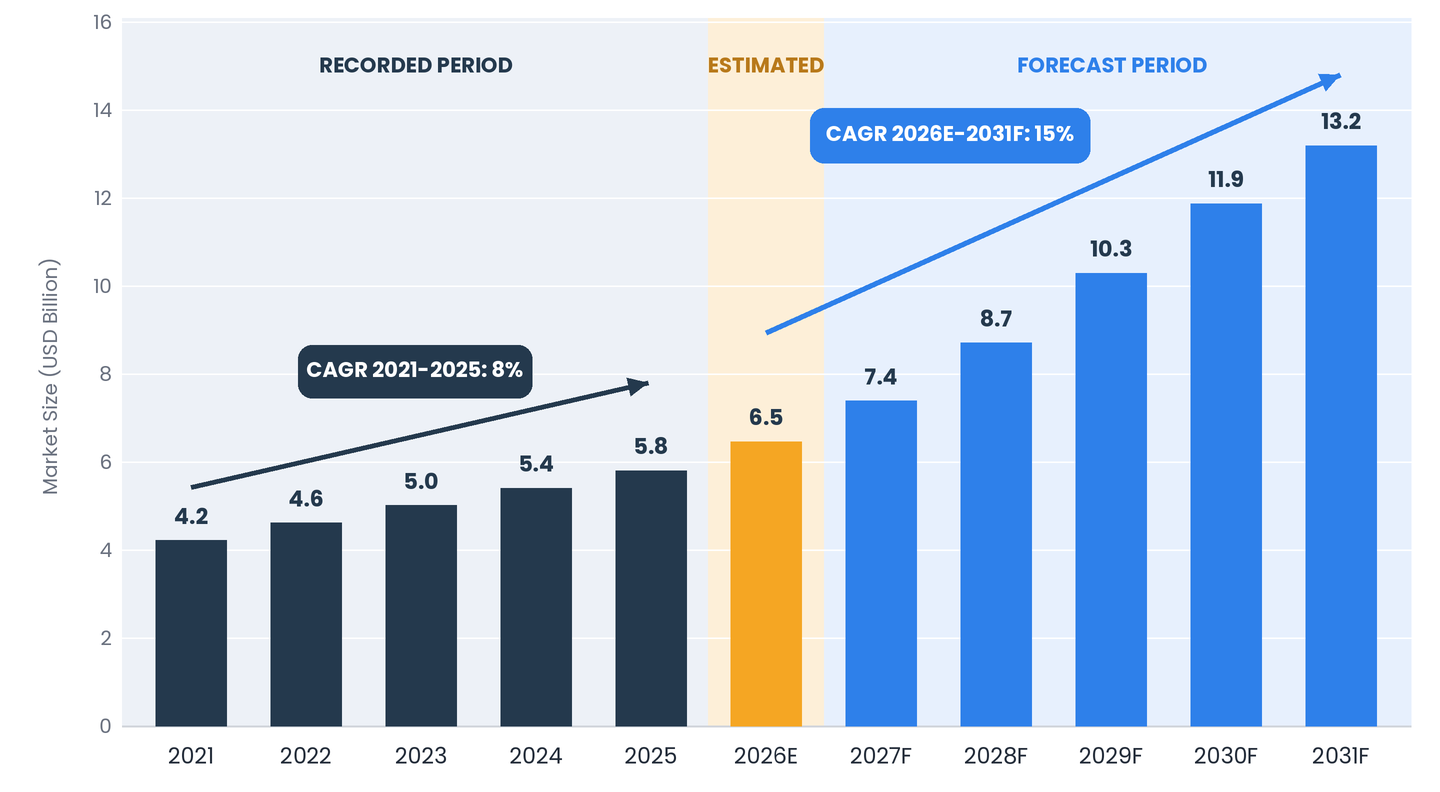
The UK is one of the world's largest offshore wind markets, and its auction system has delivered a record award. Neargoal Consulting estimates capital expenditure and operations spending at about USD 5.8 billion in 2025, rising to USD 6.5 billion in 2026E and USD 13.2 billion by 2031, a 15% CAGR over 2026E-2031F, after an 8% CAGR over 2021-2025. Allocation Round 7 awarded 8.4 GW of offshore wind across 12 projects in January 2026.
Key Takeaway Auction success has to be converted into steel in the water. Developers and suppliers that secure grid connections, vessels, cables and financing for the awarded projects will capture the largest build-out the UK has contracted. |
UK Offshore Wind Market at a Glance
MARKET DEFINITION Value of Offshore Wind Capital Expenditure and Operations and Maintenance Spending in the UK (USD Billion) | ||
BASE YEAR / ESTIMATED YEAR 2025 / 2026E | FORECAST PERIOD 2027F-2031F | |
MARKET SIZE, 2025 USD 5.8 Billion | MARKET SIZE, 2026E USD 6.5 Billion | |
MARKET SIZE, 2031F USD 13.2 Billion | RECORDED CAGR, 2021-2025 8% | |
FORECAST CAGR, 2026E-2031F 15% | ALLOCATION ROUND 7 OFFSHORE WIND AWARD 8.4 GW Across 12 Projects, January 2026 | |
ALLOCATION ROUND 7 SOLAR AND ONSHORE WIND 4.9 GW and 1.3 GW, February 2026 | CLEAN POWER 2030 OFFSHORE WIND RANGE 43-50 GW | |
LEADING COMPONENT Turbines | FASTEST-GROWING SEGMENT Floating Offshore Wind | |
KEY CONSTRAINTS Grid Connection, Supply Chain Capacity and Cost of Capital | ||
Source: Neargoal Consulting Analysis | ||
Market Outlook
Our study estimates the market will grow at a 15% forecast CAGR (2026E-2031F) from USD 6.5 billion in 2026E, after an 8% CAGR over 2021-2025. The base case assumes that Allocation Round 7 projects move to final investment decision and construction from 2026E-2027F, that spending peaks from 2029F-2030F as turbines and foundations are installed, and that operations and maintenance spending grows steadily with the installed base.
Figure 1: UK Offshore Wind Market Size, 2021-2031F (USD Billion)
Source: Neargoal Consulting Analysis
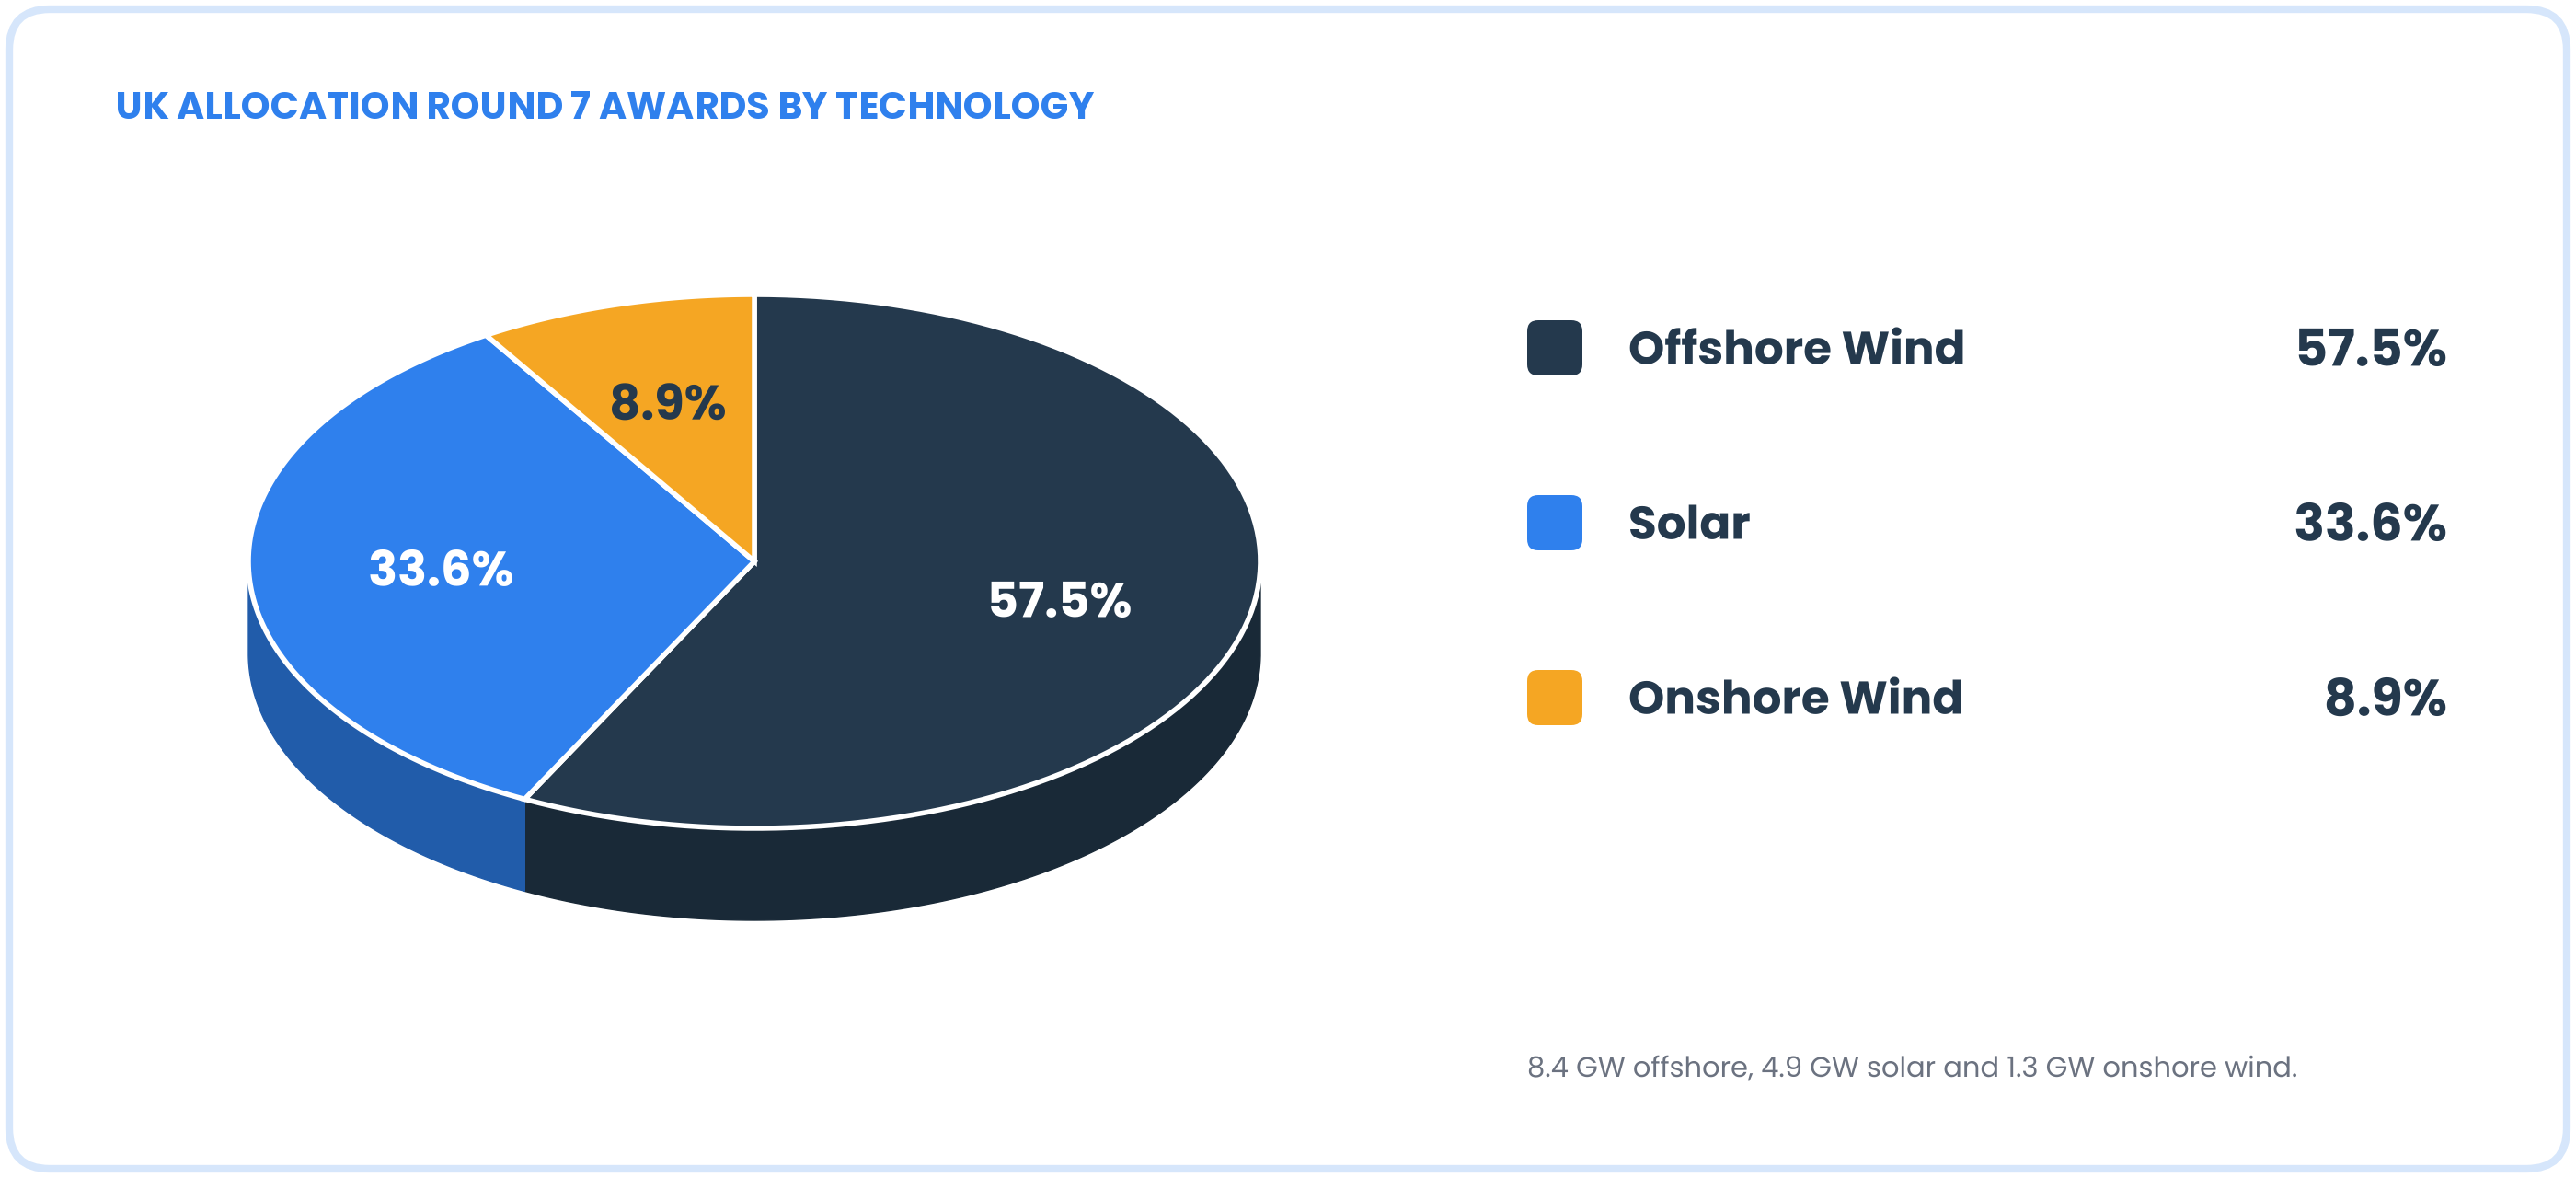
Figure 2: UK Allocation Round 7 Awards by Technology
Source: Neargoal Consulting Analysis
Market Dynamics
Growth Drivers
- Contracts for Difference Auctions. Allocation Round 7 awarded a record 8.4 GW of offshore wind across 12 projects, announced on 15 January 2026.
- Clean Power 2030. The government's Clean Power 2030 action plan sets an offshore wind range of 43-50 GW, which anchors the long-term pipeline.
- Energy Security and Domestic Supply Chain. Offshore wind reduces exposure to imported gas, and ports, cables and foundations offer local manufacturing opportunities.
Restraints
- Grid Connection and Transmission. Connection queues and transmission upgrades set when awarded projects can energize.
- Supply Chain Capacity. Turbines, cables, vessels and substations have limited capacity and long lead times.
- Cost of Capital and Inflation. Higher interest rates and input costs can challenge project economics at auction prices.
Opportunities
- Cables and Substations. Large awarded capacity needs export and array cables and offshore substations.
- Floating Offshore Wind. Deep-water sites in the Celtic Sea and Scotland open a new project class.
- Ports and Installation Vessels. Port upgrades and vessel capacity are needed to deliver the pipeline.
- Operations and Maintenance. A growing fleet creates recurring service and life-extension demand.
Policy and Regulatory Landscape
The Contracts for Difference scheme, run by the Department for Energy Security and Net Zero, is the main revenue support, with results announced by allocation round. The Clean Power 2030 action plan sets the national capacity range, and grid and planning reforms govern connection timing and consenting. Seabed leasing by the Crown Estate and Crown Estate Scotland defines the available sites. The full report assesses how auction design, grid reform and leasing rules affect timing and cost.
Segment Insights
The full report quantifies every segment; the highlights below cover Component, Foundation Type, and Project Stage.
By Component
Turbines take the largest share of spending, while cables and installation services grow quickly as awarded projects reach construction.
By Foundation Type
Fixed-bottom foundations carry almost all current capacity and the Allocation Round 7 awards, because they are proven and cost less. Floating foundations serve deeper waters and are earlier in development but open large new areas. Our analysis expects fixed-bottom projects to account for most spending through 2031F.
By Project Stage
- Operations and Maintenance. Recurring spending on the installed fleet.
- Under Construction. Capital expenditure on turbines, foundations, cables and installation.
- Development and Pre-Construction. Surveys, consenting and early engineering for awarded and planned projects.
Geographic Insights
Projects cluster around the North Sea, with Scotland and the Celtic Sea adding new areas.
- East Coast of England. Established clusters and large projects in the southern North Sea.
- Scotland. Large leased areas and growing floating wind potential.
- Irish Sea and Wales. Established projects and port capacity.
- Celtic Sea. An emerging area for floating offshore wind.
Competitive Landscape
Key participants include Ørsted, RWE, SSE Renewables, ScottishPower Renewables, Equinor, Vattenfall, Siemens Gamesa and Vestas. Competition rests on seabed access, auction pricing, supply chain contracts and cost of capital. Developers increasingly partner with infrastructure investors to finance large projects.
Ørsted | RWE | SSE Renewables | ScottishPower Renewables |
Equinor | Vattenfall | Siemens Gamesa | Vestas |
Key Developments, 2026
- 15 January 2026. Allocation Round 7 awards 8.4 GW of offshore wind across 12 projects.
- 10 February 2026. The government announces Allocation Round 7 results for solar, onshore wind and tidal, including 4.9 GW of solar and 1.3 GW of onshore wind.
- 2026-2027. Awarded offshore projects are expected to move toward final investment decisions.
- 2030. The Clean Power 2030 plan sets an offshore wind range of 43-50 GW.
What This Means for Decision-Makers
- Developers: Secure grid connections and supply contracts before final investment decisions.
- Suppliers: Plan capacity for cables, foundations and vessels against the awarded pipeline.
- Investors: Track construction milestones and cost of capital, not only awards.
- Policymakers: Align grid reform with auction timing.
About the Report
Table 1: UK Offshore Wind Market: Report Coverage
Coverage Area | What the Report Covers |
Market Size and Forecast | Revenue (USD Billion) and Capacity (GW) Views, 2021-2031F |
Segmentation | Component, Foundation Type and Project Stage |
Geography | East Coast of England, Scotland, Irish Sea and Wales, and Celtic Sea |
Competition | Developers, Suppliers and Project Pipeline Tracking |
Policy and Constraints | Auctions, Grid Reform, Supply Chain and Financing |
Outlook and Recommendations | Pipeline Assessment and Guidance by Stakeholder |
Source: Neargoal Consulting Analysis | |
The research report, UK Offshore Wind Market Outlook 2021-2031F - Market Size, Share, Trends, Opportunities, and Competitive Analysis - Segmented by Component (Turbines, Foundations and Substructures, and Cables, Installation and Services); Foundation Type (Fixed-Bottom and Floating); Project Stage (Operations and Maintenance, Under Construction, and Development and Pre-Construction); and Region, covers capital expenditure and operations and maintenance spending on offshore wind projects in UK waters, with a 2025 base year, a 2026E estimate and a 2027F-2031F forecast. It excludes electricity sales revenue, onshore wind and projects outside the UK. Market estimates and projections are based on Neargoal Consulting’s proprietary research methodology, exhaustive primary and secondary research.
For questions about report coverage, methodology, suitability, etc.
For requirements beyond the published report